Overview
To demonstrate basic Ventus capabilities, we model a simple multi-story building for winter and summer conditions. This model features metric units; Ventus supports both metric (SI) and English (US customary, EN) unit systems.
The user should work through this entire example for a concrete understanding of using Ventus. A solution model is provided in the section Before Starting.
Before Starting
- Download and install the latest version of Ventus from the Ventus download page.
- If you have not already, sign up for a free 30-day trial license or purchase a license.
- Open the latest version of the Ventus User Manual for reference throughout this tutorial.
- Download the Ventus basic first model zip folder so you can check your work.
Introduction
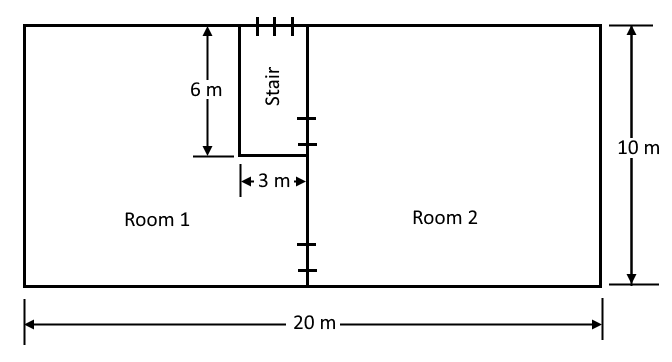
The building has eight identical levels that each have two units and a Stair. Doors provide access between the units and to the stair. We will assume high leakage through the walls and floors (a "loose" building construction). The floor-to-floor height is 3 m.
Both the identification of rooms, Figure 2, and the Flow Path areas connecting each room, Figure 3 will be used to model the airflow network and calculate pressure and flow.
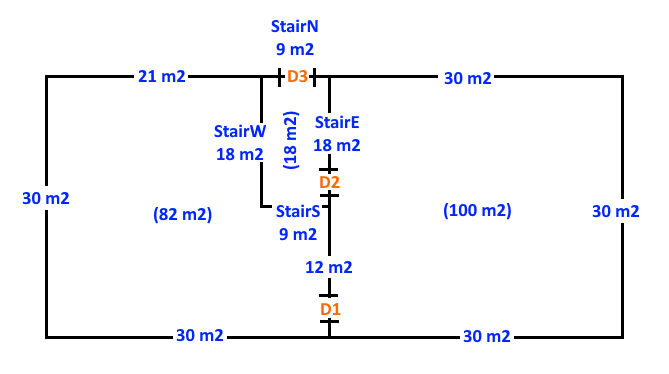
For each of the Flow Paths, the flow elements will use the loose construction leakage areas in Table 1.
| Path | Element Name | Flow Area (m²) |
|---|---|---|
| Single door (closed) | Door-SC | 0.0158 |
| Double door (closed) | Door-DC | 0.0316 |
| Wall per m² | Wall-per unit area | 3.50E-04 |
| Floor or roof per m² | Floor-per unit area | 1.70E-04 |
We will set up the model with the winter conditions in Table 2.
| Location | Winter Temperature (°C) | Summer Temperature (°C) |
|---|---|---|
| Outdoor | -15 | 33 |
| Building | 22 | 22 |
| Stairwell | -13 | 31 |
Problem Setup using Winter Conditions
Set up a New Model
Define model parameters and save the file
- Open Ventus.
- In Menu shortcuts, click SI to use metric units.
- On the View menu, click Edit Snap Grid.
This sets the grid spacing that we use when drawing the geometry.
- Enter 1 m
- Click OK.
- Set the default Zone temperature.
- On the Analysis menu, click Simulation Parameters.
- On the Environment tab, set the Default Zone Temperature to 22 °C.
- Click OK.
- Set ambient temperature.
- On the Model menu, click Weather and Wind.
- Click Edit to open the Ambient Temperature dialog.
- Change the value of the first row to -15 °C.
- Click OK to close the Ambient Temperature dialog
- Click OK to close the Weather and Wind dialog.
- On the File menu, click Save and name the file getting started winter.vnts.
Draw the zones
Draw the geometry of Level 0.0 m (Level 1)
- In the View toolbar, click Switch to the Top View. If the grid is not displayed, on the View menu, click Show Snap Grid.
- In the Drawing toolbar, double-click the Add a Rectangular Room tool.
- Draw Room 2 and Stair.
- Press ESC to unselect the tool.
- In the Drawing toolbar, click the Add a Polygonal Room tool.
- Draw Room 1 by clicking on the existing corners and then on grid points.
- After drawing the last unique point, right-click to close the polygon.
- Using the Select/Edit Objects tool, select and rename each of the rooms to Room 1, Room 2, and Stair.
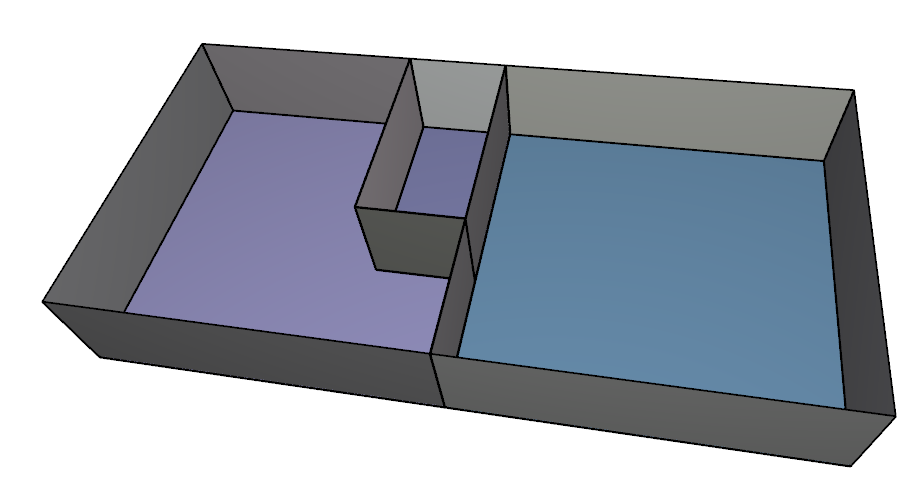
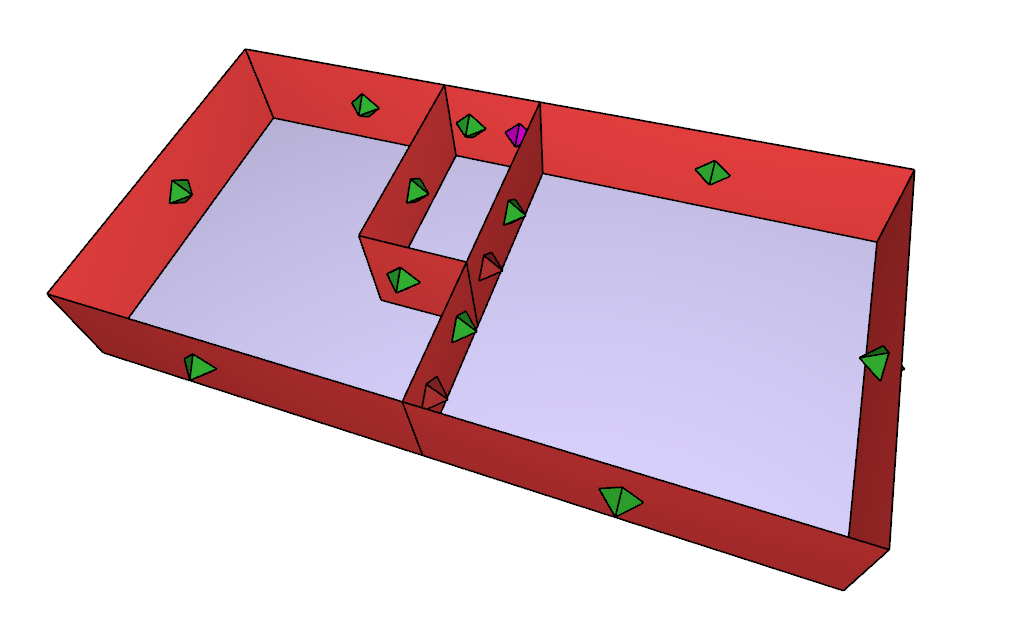
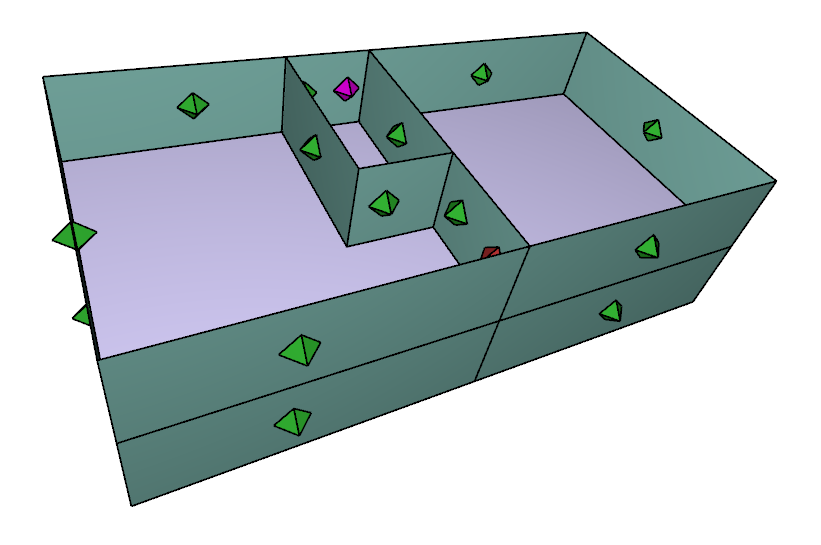
- Select the Perspective View, click Reset All, and click the 3D Orbit Navigation tool. Spin your model and the view should look as shown in Figure 4.
Define Flow Elements
The flow elements define the types of Flow Paths we will use in the model. Each Flow Path will reference a Flow Element. The flow element name and area are given in Table 1
To define flow elements
- Before we create the Flow Paths we must define the types of flow elements.
In the Object tree, double-click Flow Elements.
The names of the default Flow Elements indicate the Powerlaw Model and the Type.
The default AREA/Area flow element uses the Leakage Area Data Powerlaw model with the
per unit Areaoption. - Select the existing AREA/Item flow element and then click Duplicate. Type the Name Door-SC (a closed single door). The new flow element will be Based On the existing flow element you selected, in this case AREA/Item. Click OK to close the Duplicate Flow Element dialog.
- Change the Door-SC flow element Area per Item to 0.0158 m2. When the leakage is specified Per Item, that defines the total leakage area for that flow element. The remaining default parameters are appropriate. Click Apply.
- Repeat for the double-width door Door-DC. Change the Leakage Area to 0.0316 m2. Click the Color box and change the color to magenta. Click Apply.
- Select the existing AREA/Area flow element and then click Duplicate. Type the Name Wall. Click OK.
- Set the Area per Unit Area to 3.5E-4 m2 / m2. When the leakage is specified Per Unit Area, the total leakage area is calculated by multiplying by the wall area. The other default parameters are appropriate. Click Apply.
- Duplicate the AREA/Area element once more and name it Floor. Change the Leakage Area to 1.7E-4 m2/m2. Click the Color box and change the color to orange. Click Apply.
- Select the existing STAIRWELL flow element and then click Duplicate. Type the Name Stair. Click OK.
- The Cross-sectional Area is 18 m2. Assume zero Density of People and Closed Stair Treads. Click Apply.
- Click OK to close the Edit Flow Elements dialog.
Create the Flow Paths
To define Flow Paths
- It is easiest to work in the top view, so click Switch to the Top View in the View toolbar.
- We will turn off snapping to the existing grid to make it easier to place the Flow Path in any location. In the View menu, unselect Show Snap Grid.
- In the View toolbar above the workspace, de-select Show Object Labels.
- Double-click the Create a Flow Path Between Two Walls tool (the double-click makes the tool stay active for multiple paths).
- Select the Element type Wall.
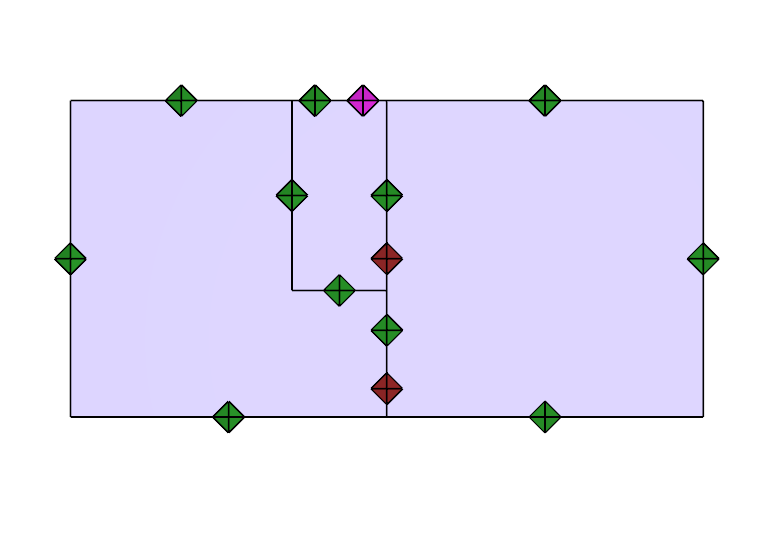
- Click and drag to create 11 wall Flow Paths (the green paths shown below).
- To make a Flow Path between zones, click in one Zone and drag to the second Zone.
- To make a Flow Path to ambient, click in the Zone and drag outside the Zone. The wall area of the Flow Paths is automatically calculated and used as the multiplier.
- Now add the door Flow Paths. Using the Create a Flow Path Between Two Walls tool, select the Element type Door-SC. For AREA/Item flow elements the multiplier is assumed to be a value of 1.
- Add the two single doors, Door-SC (the maroon paths shown below).
- Select the Element type Door-DC and add the double door Door-DC (the magenta path shown below).
- Press ESC to leave the Create a Flow Path Between Two Walls tool.
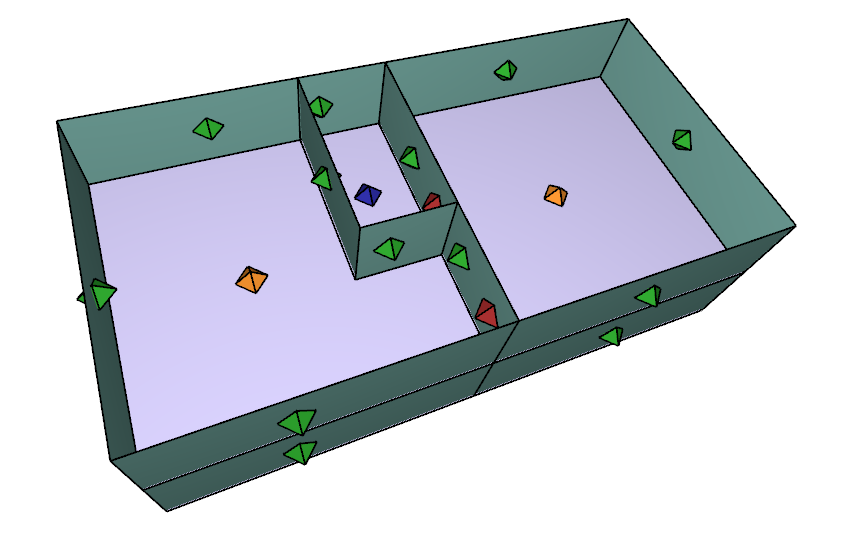
- When you are finished, your model should look like Figure 5.
Set Stair Temperature
We set the Stair temperature to -13 °C, the winter condition defined in the Problem Setup using Winter Conditions section.
To set temperature for the Stair Zone
- Using the Select/Edit tool, select the Stair Zone.
- Select the checkbox for Temperature and type -13 °C.
Rename Stair Wall Flow Paths and Verify Wall Areas
In order to make it easier to find the walls that surround the stairs, we will rename the wall Flow Paths using the names shown in the Problem Geometry section above.
To rename stair Flow Paths and verify flow area coverage
- Using the Select/Edit tool, click on each of the four wall Flow Paths surrounding the stair and change their names (StairN, StairS, StairE, StairW).
- Also rename the two doors that access the stair (D2 and D3).
- Click on each Flow Path to verify that the areas match expected values.
- You can also display the Flow Path Area coverage.
In the View Toolbar, click the
 Show Flow Path Input Geometry tool.
This is an easy way to see that all per unit area Flow Paths has been defined.
Show Flow Path Input Geometry tool.
This is an easy way to see that all per unit area Flow Paths has been defined.
A short summary of the wall area calculation is useful.
- The area calculation is only done when the leakage is specified as per unit area.
- The second wall is projected onto the first wall like in Figure 7. Here the lower Flow Path was created by dragging from the left to right. The wall of the second Zone is projected onto the first wall.
- A similar per unit length calculation can be used as well.
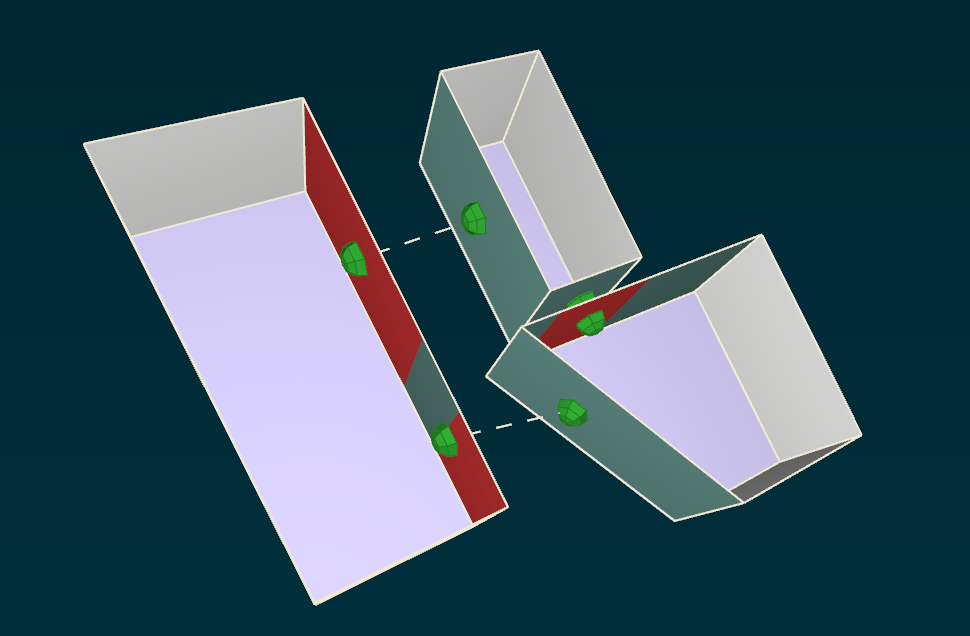
If the walls are not parallel, the calculated area will depend on the definition of the first and second walls since the projection will be slightly different. Any Flow Path where the angle between walls is greater than 1° will have a warning flag. You can also edit a Flow Path to manually specify the area you desire; if you select the Flow Path object, the Leakage Area can be edited in the ribbon.
Save the model
On the File menu, click Save.
Copy Level 1 to Level 2
In the Level Creation/Sorting part of the Properties panel, ensure that Ventus is set to Auto sort schematics components and to Automatically create levels with a default height of 3 m.
To copy objects, we select them and then use the Copy/Move Objects tool. One easy way to select and copy objects is with the Select/Edit Objects tool; click and drag to select all the objects you want to copy as in Figure 8. Another way is to select objects in the Object tree.
As in Figure 8,
Create Level 2 by copying Level 1
- Using the Select/Edit Objects tool, click and drag to select all the Zones and Flow Paths on
Level 0.0 m. - Click the Copy/Move Objects tool. Select Copy Mode and make 1 copy. Type 3 m in the Move Z box and press TAB. Click Copy/Move or press ENTER
- Go to Perspective View and click Reset All. Your model should look like Figure 9.
Edit Level 2
Often the ground floor (first level) is different from the higher levels. In this example, there is no double door from the stair to the exterior for any of the levels above the ground level. We will also add Floor Flow Paths from the active level rooms to the rooms below and add the Stair Flow Path.
To update the geometry and Flow Paths for Level 3.0 m (Level 2)
- Delete the double door from the stair to the exterior.
- Double-click the one point Flow Path tool. Select the Element Floor.
- Click on the floors of the two rooms to add Flow Paths to the rooms below.
- Select the Element Stair. Click on the stair Zone to add the Flow Path to the stair below.
- Press the ESC key or Right-click to unselect the tool.
- Your model should look like Figure 10.
Configure the view
We can configure the rendering to provide some opacity in order for easier viewing and editing.
To configure the view
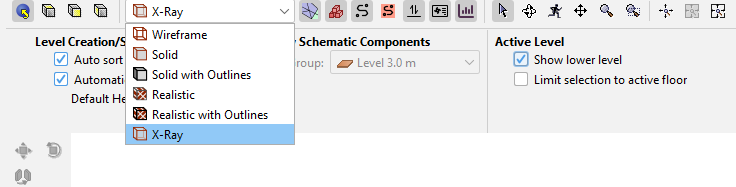
- In the View toolbar use the Change how geometry is rendered dropdown to select the X-Ray option.
- In the Active Level panel of the property editor ribbon, select Show lower level.
- In the Object tree, right-click on
Level 3.0 mand click Set as Active Level.
You now see Level 3.0 m and the level below, with a default X-Ray Opacity of 50 %.
X-Ray Opacity can be configured by navigating to the View menu and clicking Edit X-Ray Opacity
Copy Level 2 to Levels 3 through 8
Now we copy Level 2 to Levels 3 to 8.
To create Levels 3-8 by copying Level 2
- In the Level Creation/Sorting Menu, ensure that Ventus is set to Automatically create levels with a default height of 10 ft.
- To select and display only Level 2, in the Object tree, right-click
Level 3.0 m(Level 2) and click Set as Active level. In the ribbon unselect Show lower level. Using the Select/Edit Objects tool, click and drag to select all the Zones and Flow Paths on Level 3.0.
- Click the Copy/Move Objects tool. Select Copy Mode and make 6 copies. Type 3 m in the Move Z box. Click Copy/Move.
- Go to the Perspective View and click Reset All.
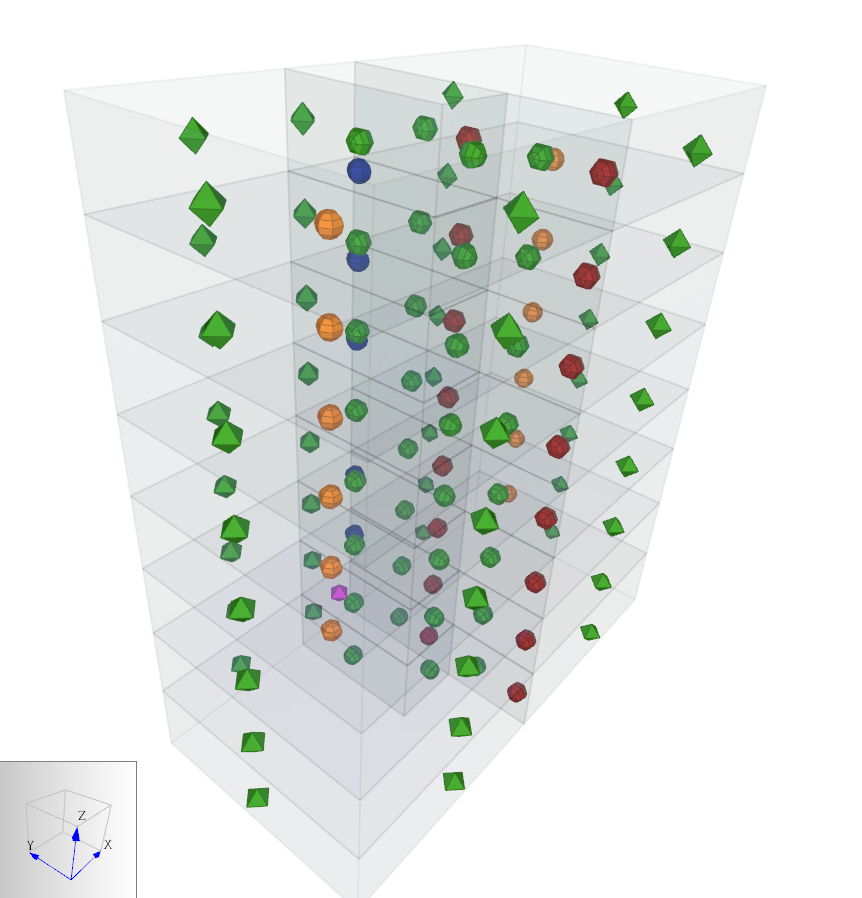
- In the Object tree, right-click Levels and click Show All to display all levels.
- Change the Opacity to 20 % from the Edit X-ray Opacity option in the View menu.
- Your model should look like Figure 12.
Create the Roof on Level 9
Next, define a flat roof above the upper level
- With the highest level active, select only the zones and floor type Flow Paths
- Copy the zones and floor Flow Paths from Level 21 m up 3 m. A new level, Level 24.0 m will be automatically created.
- Rename the new level Roof.
- Select all the zones on this new level.
- In the Property panel change the Room Type to Ceiling.
- Add a new floor Flow Path on this level above the stairwell. Since the Roof leakage matches the Floor leakage in Table 1, it is ok to use the Floor flow element.
By adding the roof, it is easy to model any vertical leakage from the top of Level 8 (Level 21.0 m) to Ambient. The roof ceiling-type zones will provide area values to the per unit area Floor Flow Paths.
Run the Simulation
To run the simulation
- On the Analysis menu, click Run Simulation. If successful, the final line in the Run Simulation dialog will be DONE!
- Click OK to close the Run Simulation dialog.
Process Winter Results
We can now process the results. There are several options.
Winter Shaft Report
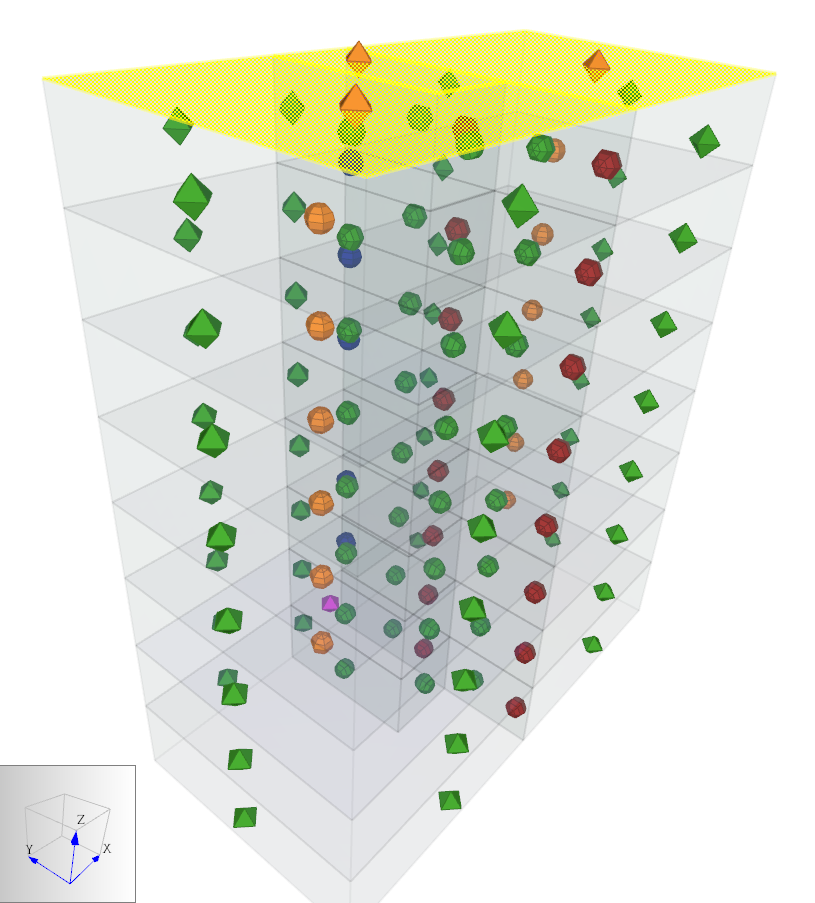
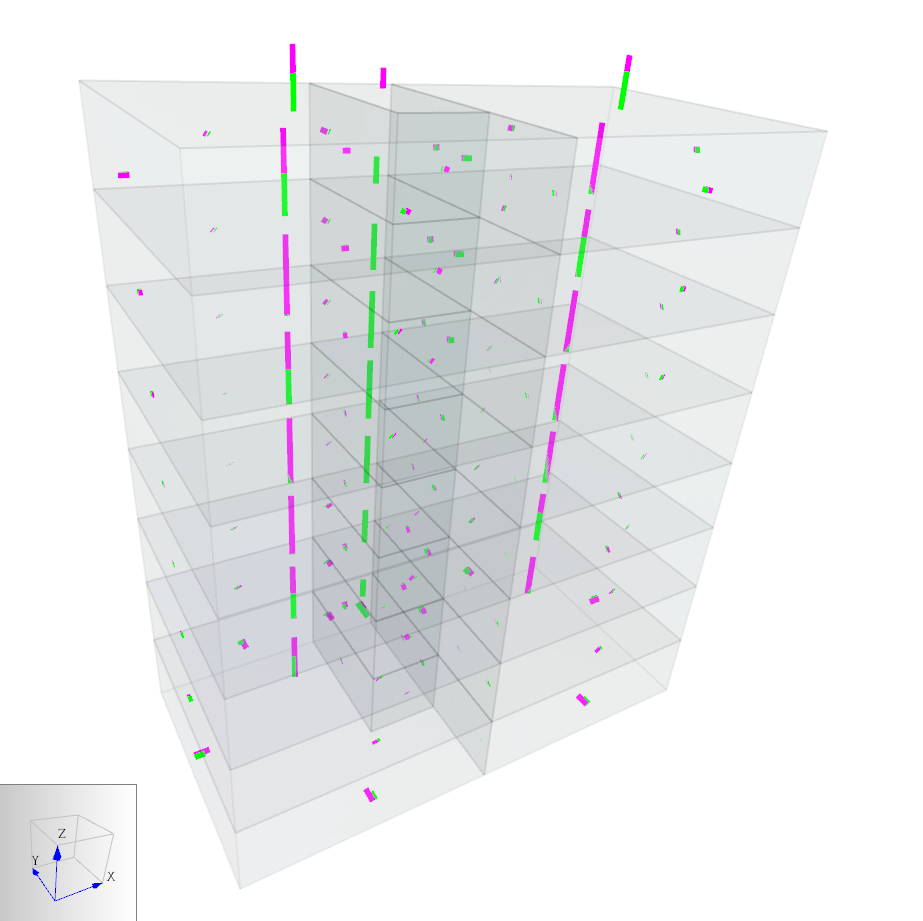
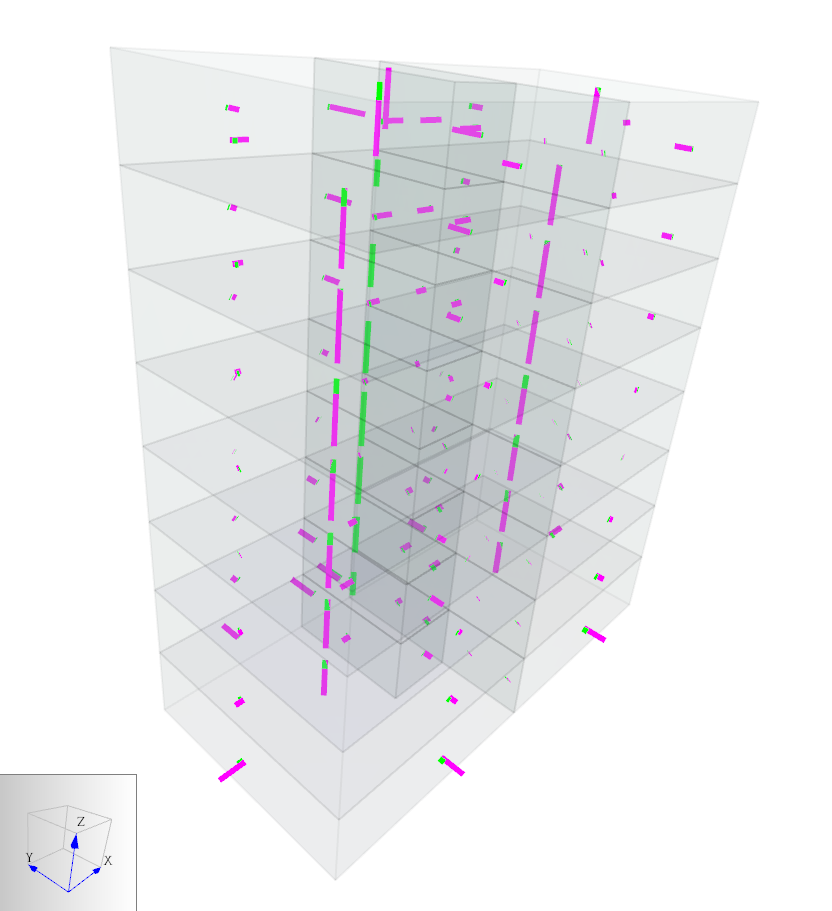
The graphical display shows lines representing the pressure difference (magenta) and the flow rate (green) at each Flow Path.
To view pressure differences
- In the View toolbar, select Show Results.
- In the Object tree, right-click on Flow Paths and click Hide.
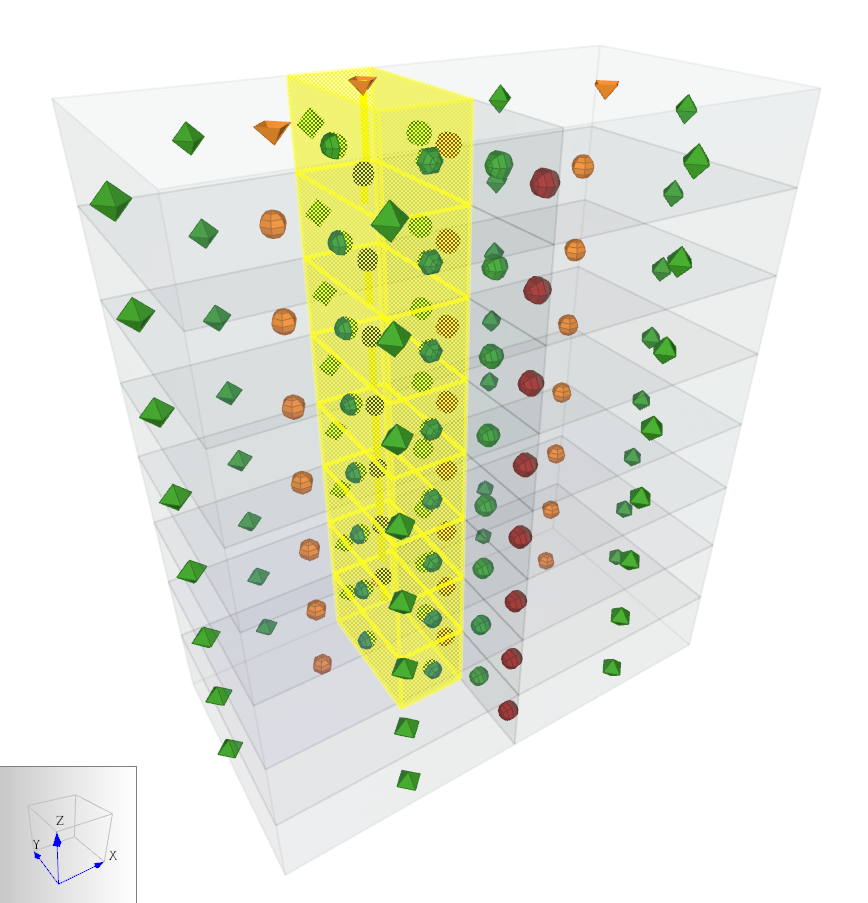
- Your model displays arrows showing the pressure difference and flow as shown in Figure 14.
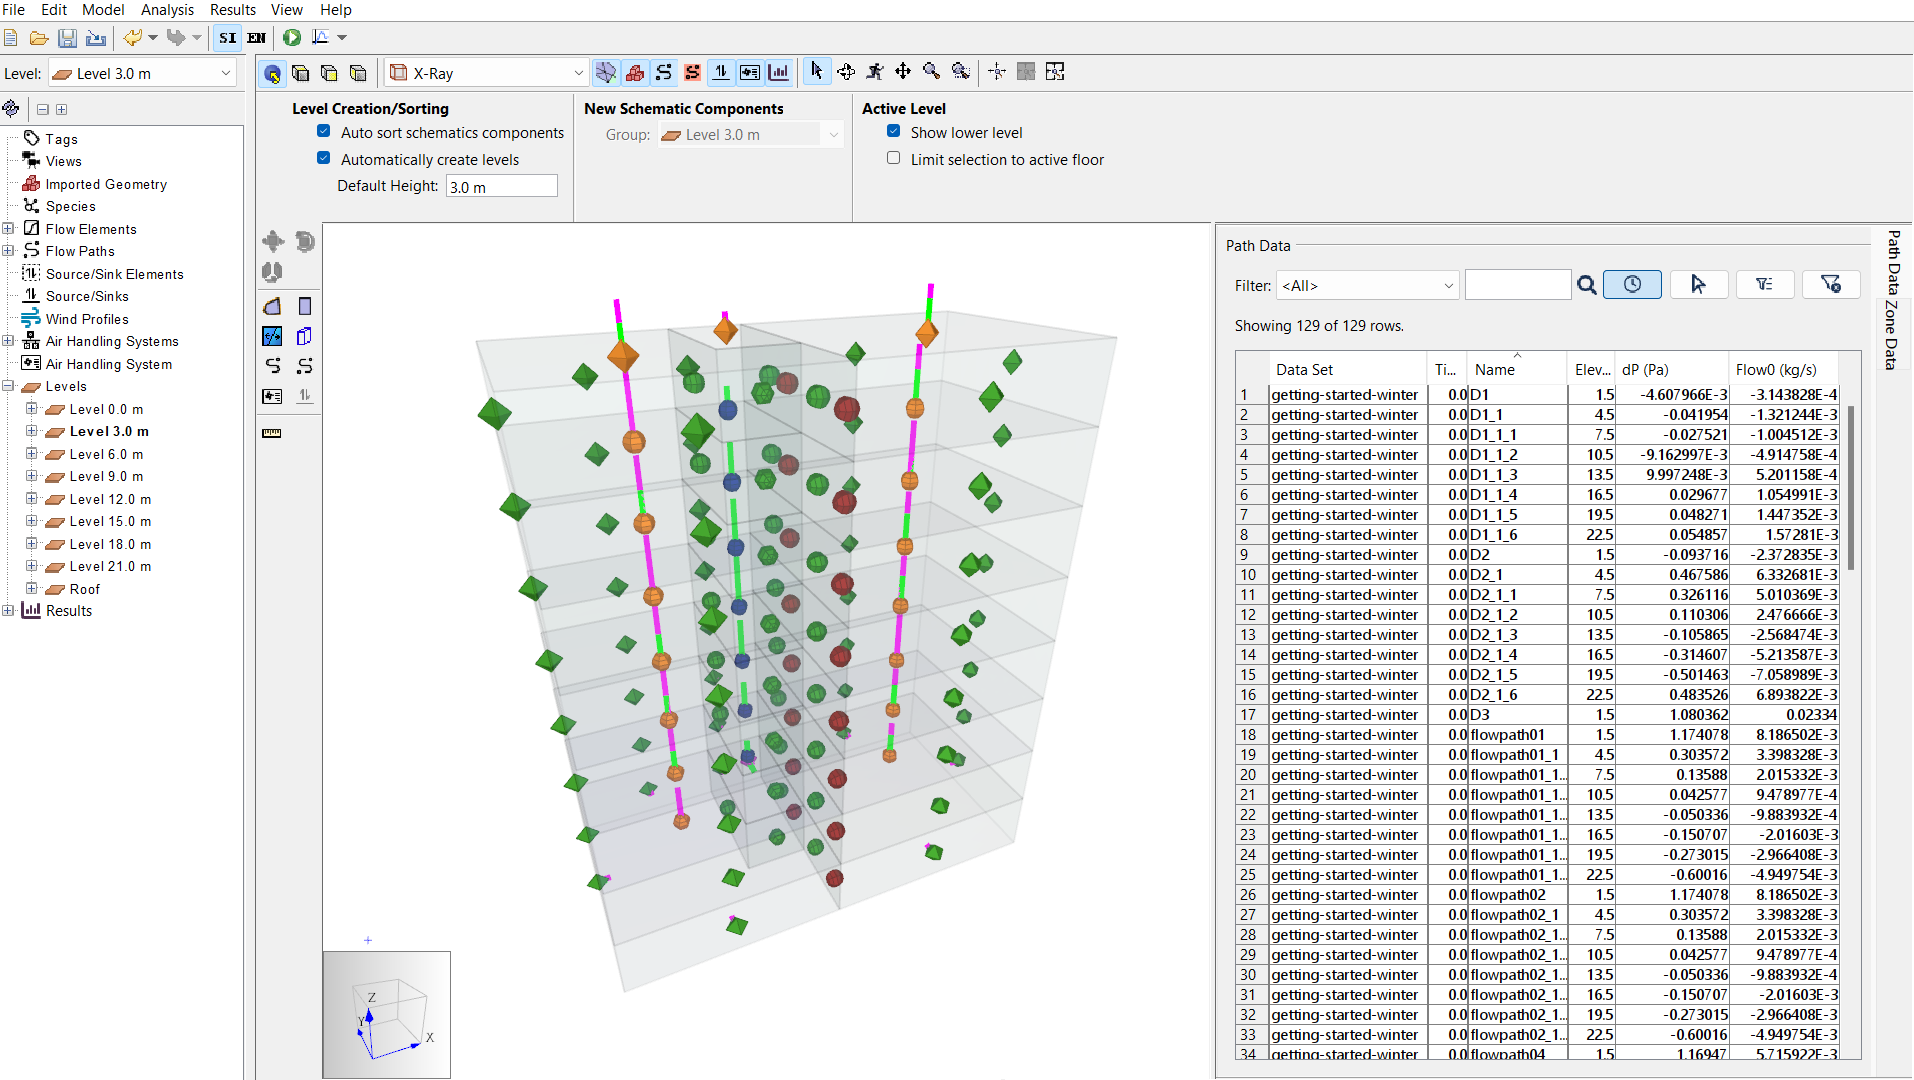
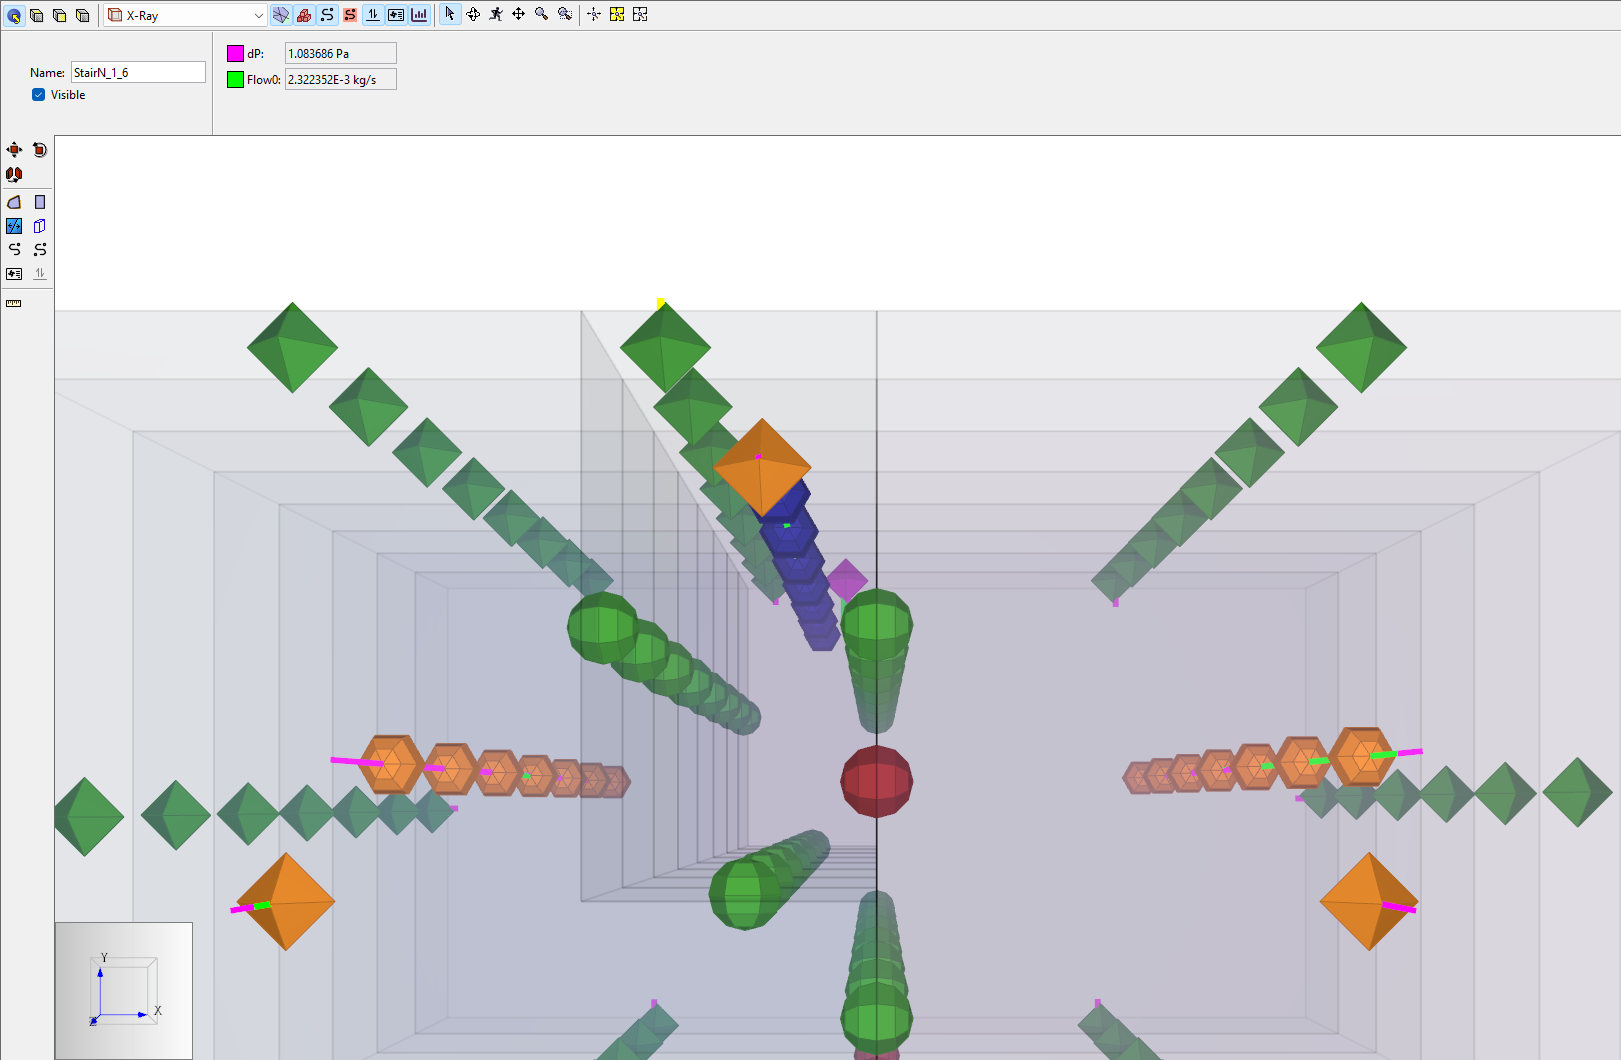
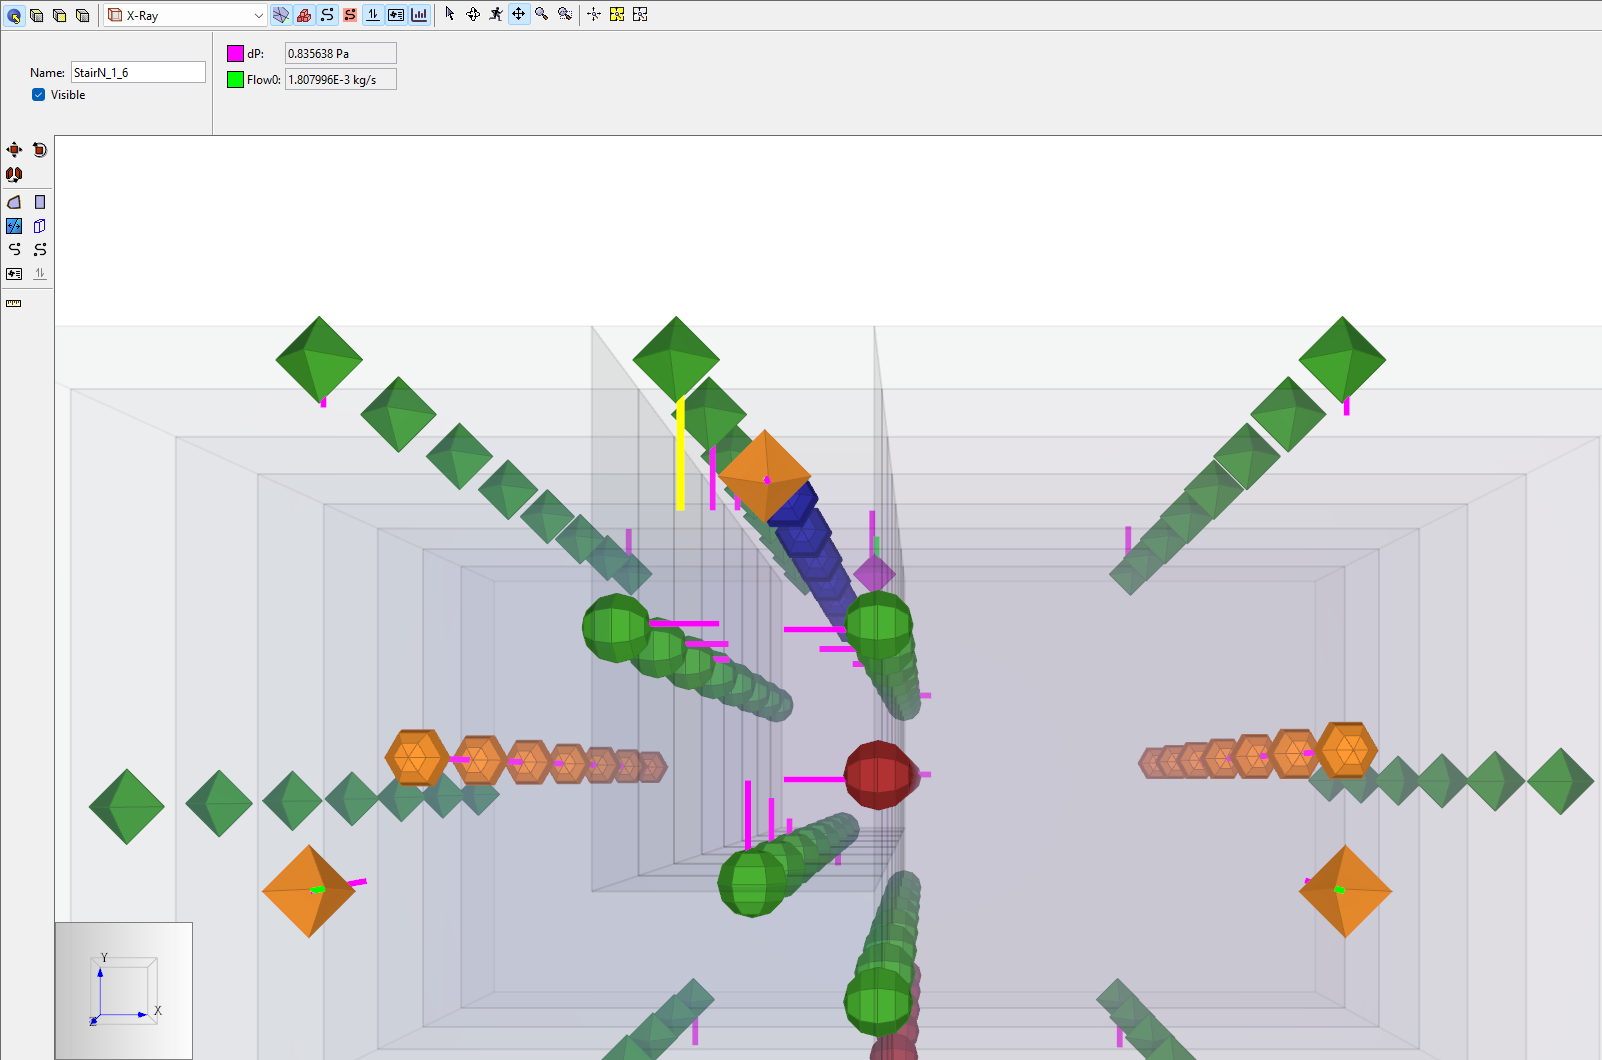
You can select a Flow Path to see the pressure difference (dP) and flow rate (flow0) displayed in the Properties panel, as in Figure 15. These match the ContamW model results.
Tabular Display of Results
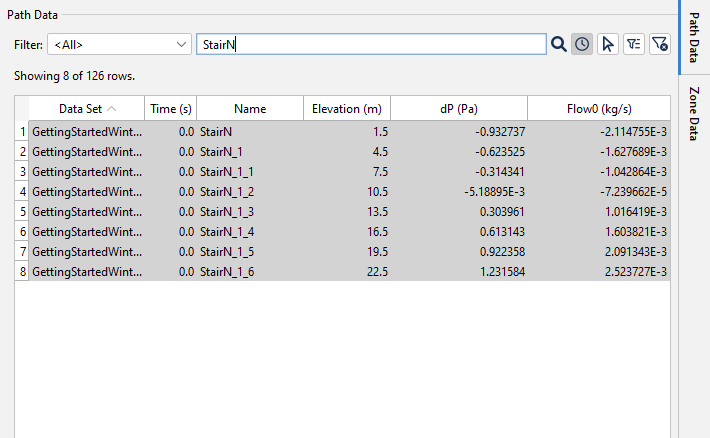
We can also filter and display the Flow Path data using a tabular display built into Ventus.
To show a table of Flow Path data for the North Stair
- On the right of the screen, click Path Data. The Results panel displays all results for the simulation.
- To filter to just the north Flow Paths, in the search box type StairN. The search is case-sensitive. See Figure 16.
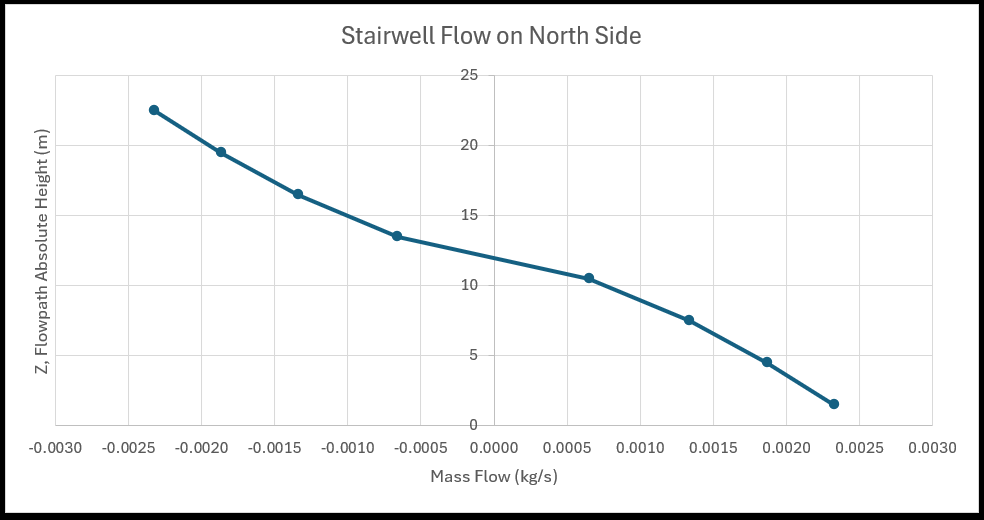
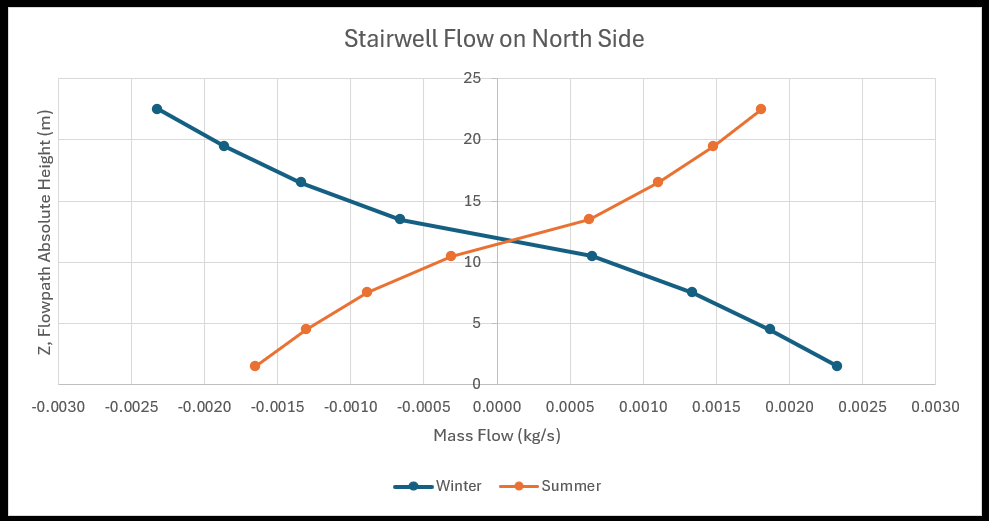
You can now use this data and make a graph of the results using external software. We will plot the Z location as a function of flow rates of the North stair Flow Paths to visualize stack effect, as in Figure 17. This plot is also known as a Shaft Report.
Work with a Results file
We can save a file of tabulated results for zones and Flow Paths. To create this data, Ventus uses a combination of the simread executable provided by ContamX and the internal Ventus linking of names to Flow Paths. The names give us a way to use a spreadsheet to display only Flow Paths connected to the stair. This description uses Excel.
To work with the results data using spreadsheet software
- In the Object tree, under Results double-click Link-Path Flows. This will open a tab in your browser.
- Copy all the data in the browser page (press CTRL+A to select all, then CTRL+C to copy).
- Paste the data into Excel (press CTRL+V to paste in empty Excel sheet).
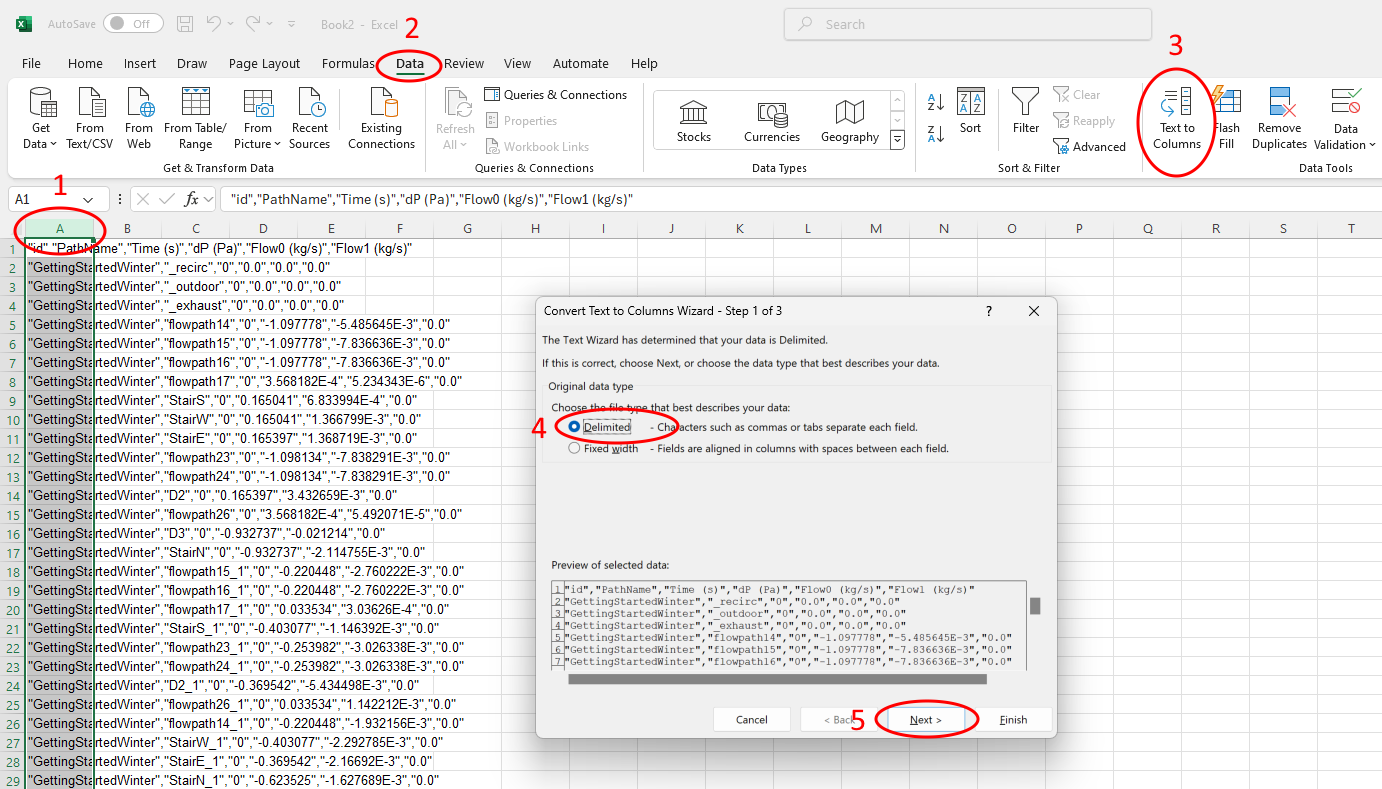
- This data is comma separated. To convert to columns, click column A, on the Data tab, click Text to Columns, select Delimited, and click Next.
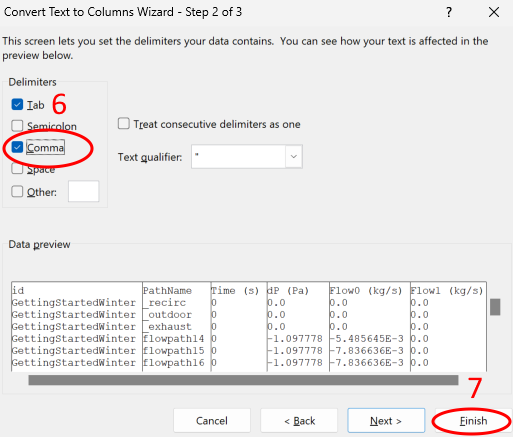
- In the Convert Text Wizard, click Comma and then click Finish. The values will now be displayed in columns.
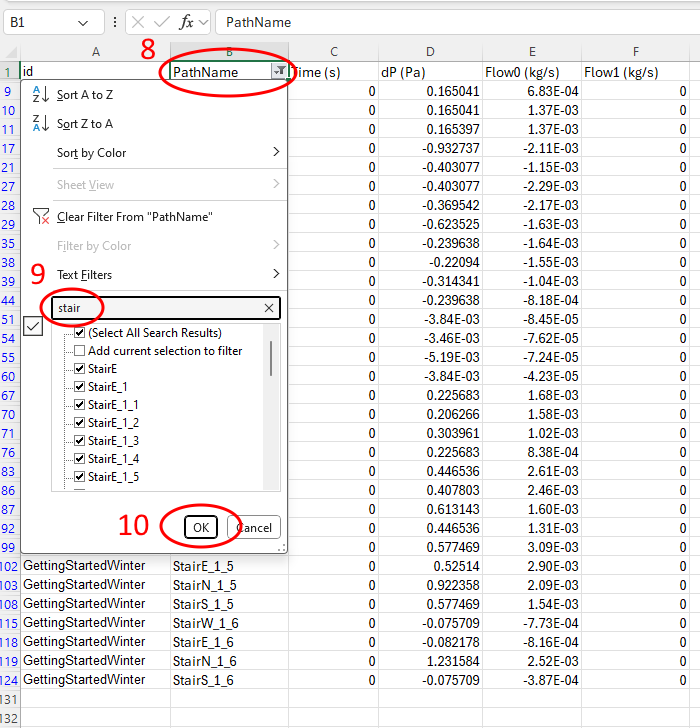
- To filter to see only connected to the stair, click PathName and then click Filter. Select the PathName dropdown. In the search enter stair, and click OK.
- Now only Flow Paths that include "stair" in their name are displayed.
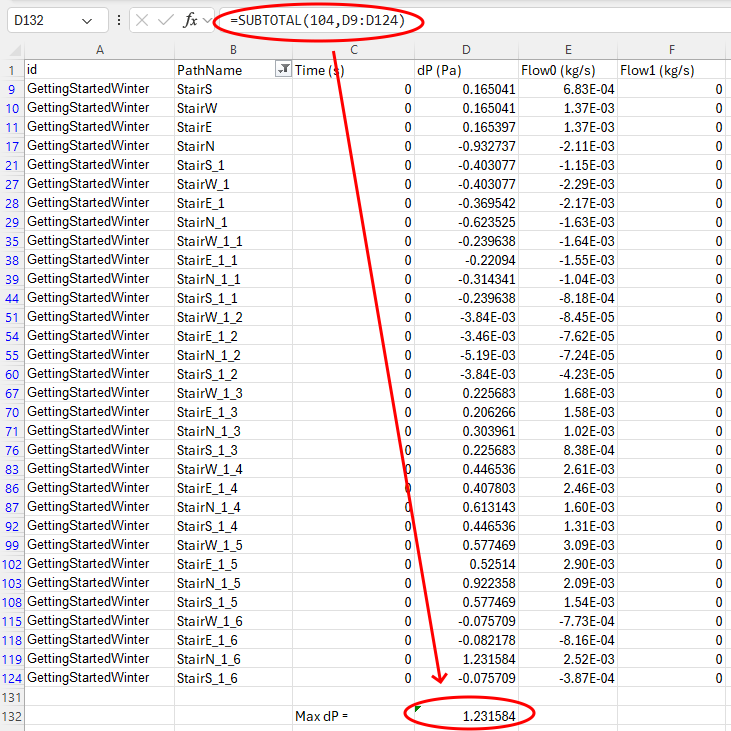
- Use the SUBTOTAL function to work with only the filtered data. Figure 21 shows how to find the maximum pressure difference for only the stair Flow Paths.
Instructions for Summer Conditions
In Ventus, from the getting started winter model, save the file for a separate run.
To save another version
- On the File menu, click Save As and name the file getting started summer.
Change the weather
Set the ambient temperature
- On the Model menu, click Weather and Wind.
- Edit the default Ambient Temperature to 33 °C.
- Click OK to close the Ambient Temperature dialog and then click OK to close the Weather and Wind dialog.
Ventus has a warning system built in to avoid stale (out of date) data display. When you make changes to the model data without re-running the program,
caution icons appear on the Results folder(s) in the Object tree.
Change the Stair Temperatures to 31 °C
We select all the Zones for which we want to specify summer temperatures.
To change the stair temperatures
- In the Object tree, right-click on the Roof level. Select Hide.
- Click on the Top View.
- Using the Select tool, click and drag a small rectangle in the stairwell. Do not select any Flow Paths.
- Return to the Perspective View, and you should see all Zones in the stair selected. See Figure 22.
- In the ribbon, click to check Temperature and enter the value 31 °C.
Run the Simulation
- On the Analysis menu, click Run Simulation. If successful, the final line in the Run Simulation dialog will be DONE!
- Click OK to close the Run Simulation dialog.
Notice that the naming of the Results data folders in the Object tree has changed to reflect the getting started summer model conditions.
The results data is also free of any ![]() stale results warnings.
stale results warnings.
Process Summer Results
We can now process the results.
To show pressure differences
- In the Object tree, right-click on Flow Paths and click Hide.
- In the Object tree, select Levels and set the Opacity to 20 %.
- Your model displays arrows showing the pressure difference and flow. Note how the flows in the summer conditions, Figure 23, have reversed relative to winter results, Figure 14.
In Figure 24 we present the Summer flow results at the top of the stairs facing North. These match the ContamW model dP and flow0 results.
Combined Shaft Report
The summer data can be combined with earlier results to create Figure 25.
Conclusion
This model provided step-by-step guidance to create your first basic model and simulate two seasonal conditions.
You learned how to
- Draw Zones and Flow Paths
- Model network leakage airflow
- Work with results in Ventus
- Understand the outputs of ContamX
- Export results from Ventus
- Create a simple Shaft Report
- Compare Winter and Summer conditions in separate models
To continue learning Ventus, visit the Ventus tutorial list and choose your next topic. Please contact support@thunderheadeng.com with any questions or feedback regarding our products or documentation.
Related Tutorials
How to simplify post-processing data collection with seasonal scenarios and scheduled stairwell temperatures.
(Legacy) Tutorial to experience the fundamental features of PyroSim
Tutorial demonstrating how to model jet fans in Pyrosim.
Tutorial demonstrating how to use PyroSim/FDS to Maximize Solar Panel Convective Cooling.
Tutorial demonstrating how to create and FDS Velocity Patch in Pyrosim.
Tutorial demonstrating how to model critical velocity in Pyrosim using the example of a tunnel fire.
Tutorial demonstrating how to verify HVAC Pressure Drop in Pyrosim.
Third example from the ASHRAE Handbook of Smoke Control Engineering, Klote et al., 2012. Chapter 14 of the handbook, Network Modeling and CONTAM