To follow along with this tutorial, download the relevant files here.
Introduction
This post gives examples of leakage modelling using pressure zones and HVAC vents. Since version 2017.2, PyroSim has supported both pressure zone and local HVAC leakage in the user interface. Leakage refers to the air that escapes through small gaps (i.e at the top of a door) as a compartment is pressurized by a fire. The leakage area can be smaller than the mesh size so the gaps cannot be modeled directly, instead the HVAC model in FDS is used to connect the leaking compartment to the outside.
Pressure zones and leaks are discussed in Section 9.3 of the FDS User’s Guide.
"The compartment surface that is leaking can be thought of as a large HVAC vent that connects via a very small duct to the outside. This allows the leakage to be removed over a large area in the domain (just as it would be in reality) while correctly capturing the actual area of the leakage path. There are two approaches to this. The first approach is by exploiting only pressure zones. A pressure zone is a user-specified volume within the computational domain that is entirely surrounded by solid obstructions. For example, the interior of a closed room can be, and should be, declared a pressure zone. In this approach surfaces within a pressure zone are denoted as leaking and those surfaces can be considered an HVAC vent that connects to the outside via a tiny duct whose area is the leakage area. … The second approach is intended for leaks with well defined locations (a cracked open door where the crack size is subgrid) or for leaks where the stack effect is important. It uses the local pressure (which includes the zone pressure), which allows for leakage to vary in magnitude." (McGrattan et al. 2021)
We will demonstrate both approaches.
Using Pressure Zones
When working with a sealed compartment, the concept of pressure zones is important. As described in the FDS manual:
"FDS assumes pressure to be composed of a "background" component, plus a perturbation pressure. Most often, p is just the hydrostatic pressure, and ˜p is the flow-induced spatially-resolved perturbation. You can specify any number of sealed compartments within the computational domain that can have their own "background" pressures, and these compartments, or "pressure zones," can be connected via leakage and duct paths whose flow rates are tied to the pressure of the adjacent zones." (McGrattan et al. 2021)
The user is responsible for identifying and defining the pressure zones that correspond to sealed compartments. If the solution within the sealed compartment is important for your simulation, then you must define a pressure zone for that compartment. Pressure zones are not required if isolated rooms are not of interest to the simulation. When defining the pressure zones:
- "The pressure zones must be completely within a region of the domain that is bordered by solid obstructions. If the sealed region is not rectangular, FDS will extend the specified ZONE boundaries to conform to the non-rectangular region." (McGrattan et al. 2021)
- "Pressure zones can span multiple meshes. If the ZONE spans multiple meshes, make sure that the specified rectangular coordinates do so as well. This allows FDS to determine the actual extent of the ZONE independently for each mesh." (McGrattan et al. 2021)
- "It is possible to break pressure zones by removing obstructions between them. If you plan to have one zone open up to another via the removal of an obstruction, make sure that the coordinates of the two zones abut (i.e., touch) even if one of the zones includes the solid obstruction that separates them." (McGrattan et al. 2021)
The following zone_shape example demonstrates using pressure zones and opening connections between zones during the solution.
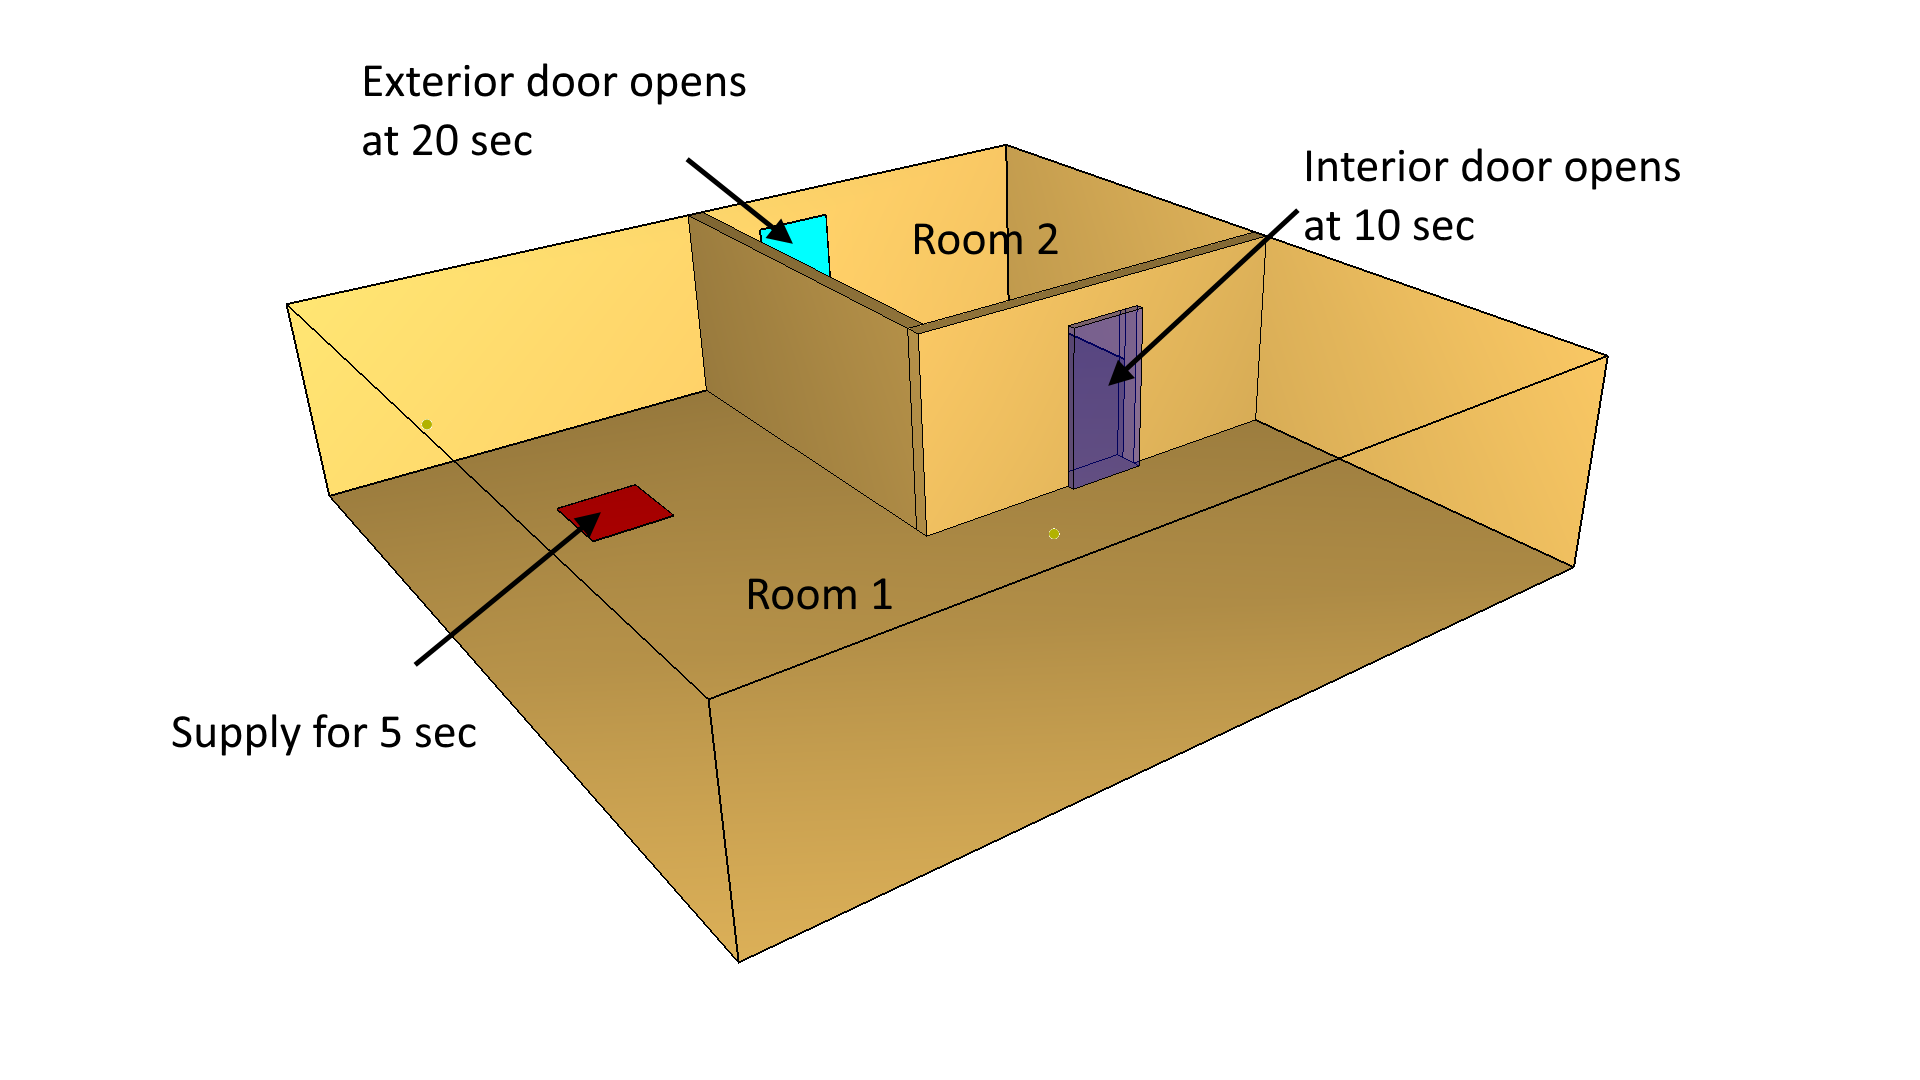
Figure 1 shows the model consisting of two sealed compartments.
At time zero, the air supply blower adds air to Room 1, pressurizing Room 1.
The blower stops at 5 s, so Room 1 pressure remains constant until the interior door opens at 10 s.
This reduces the pressure in Room 1 and increases pressure in Room 2 until they become equal.
At 20 s, the exterior door in Room 2 opens.
This vents air to the exterior and all pressures return to ambient.
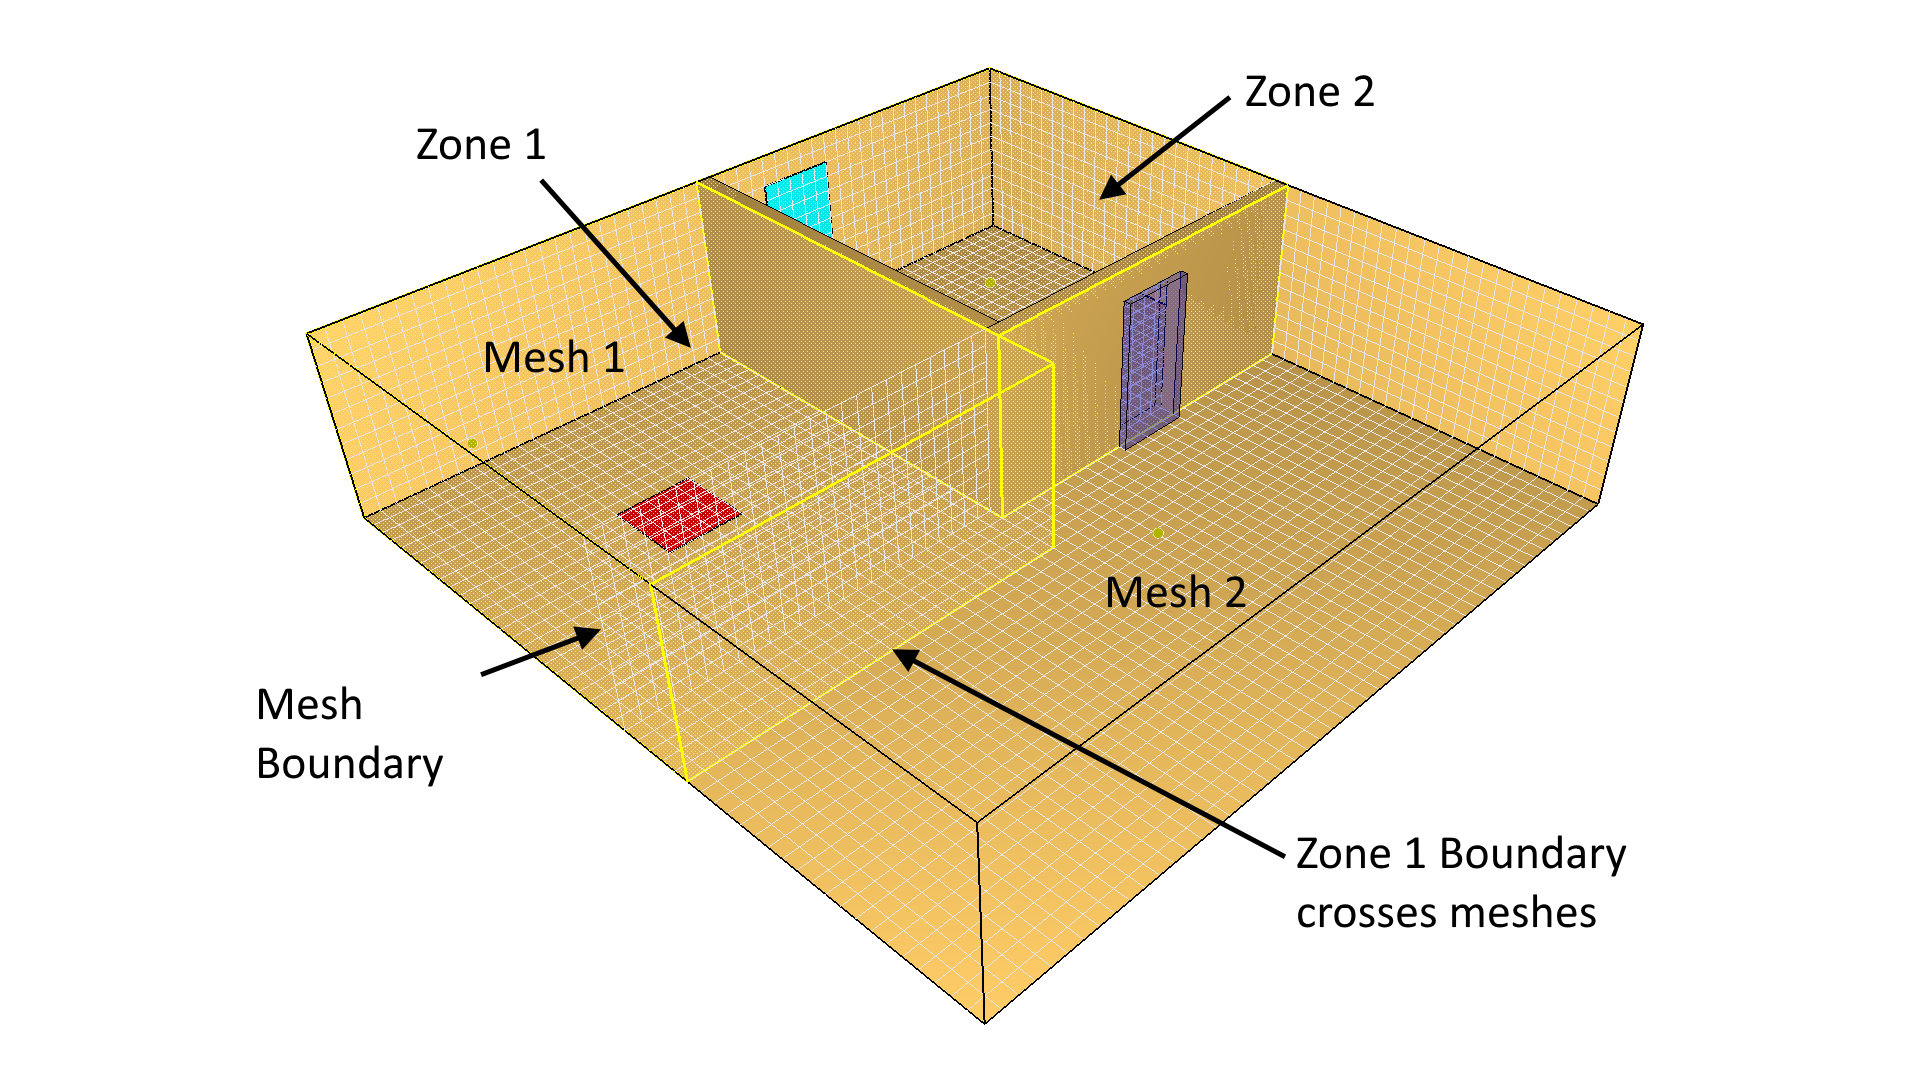
Pressure zones must be used for both rooms. Figure 2 shows the two meshes used for the solution and the two pressure zone boundaries. Because Room 1 is L-shaped, Zone 1 is defined within the room and we rely on FDS to extend the boundaries to conform to the non-rectangular region. Note that Zone 1 intentionally spans the two meshes.
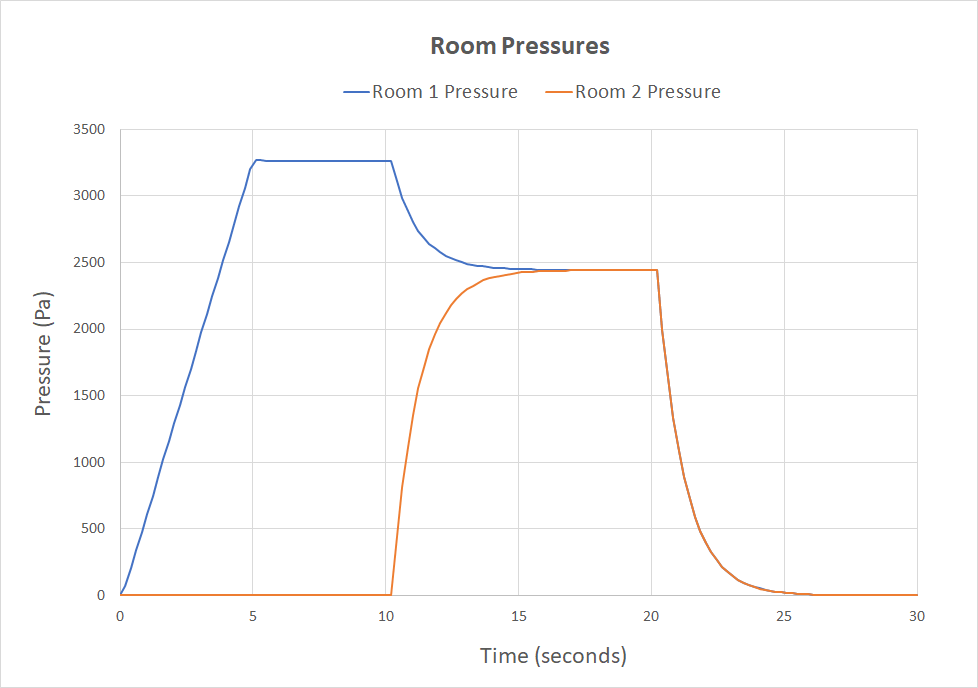
The solution is shown in Figure 3 and matches the expected results.
Pressure Zone Leakage
As described in the FDS manual, "The pressure zone leakage approach is intended to capture the bulk leakage that occurs through walls." (McGrattan et al. 2021) Pressure zone leakage uses the pressure difference between the "background" pressure of two zones to calculate the leakage flow. It is assumed the flow is small and that flow into a zone will be at that zone’s temperature (no heat transport from the zone from which the leak is occurring).
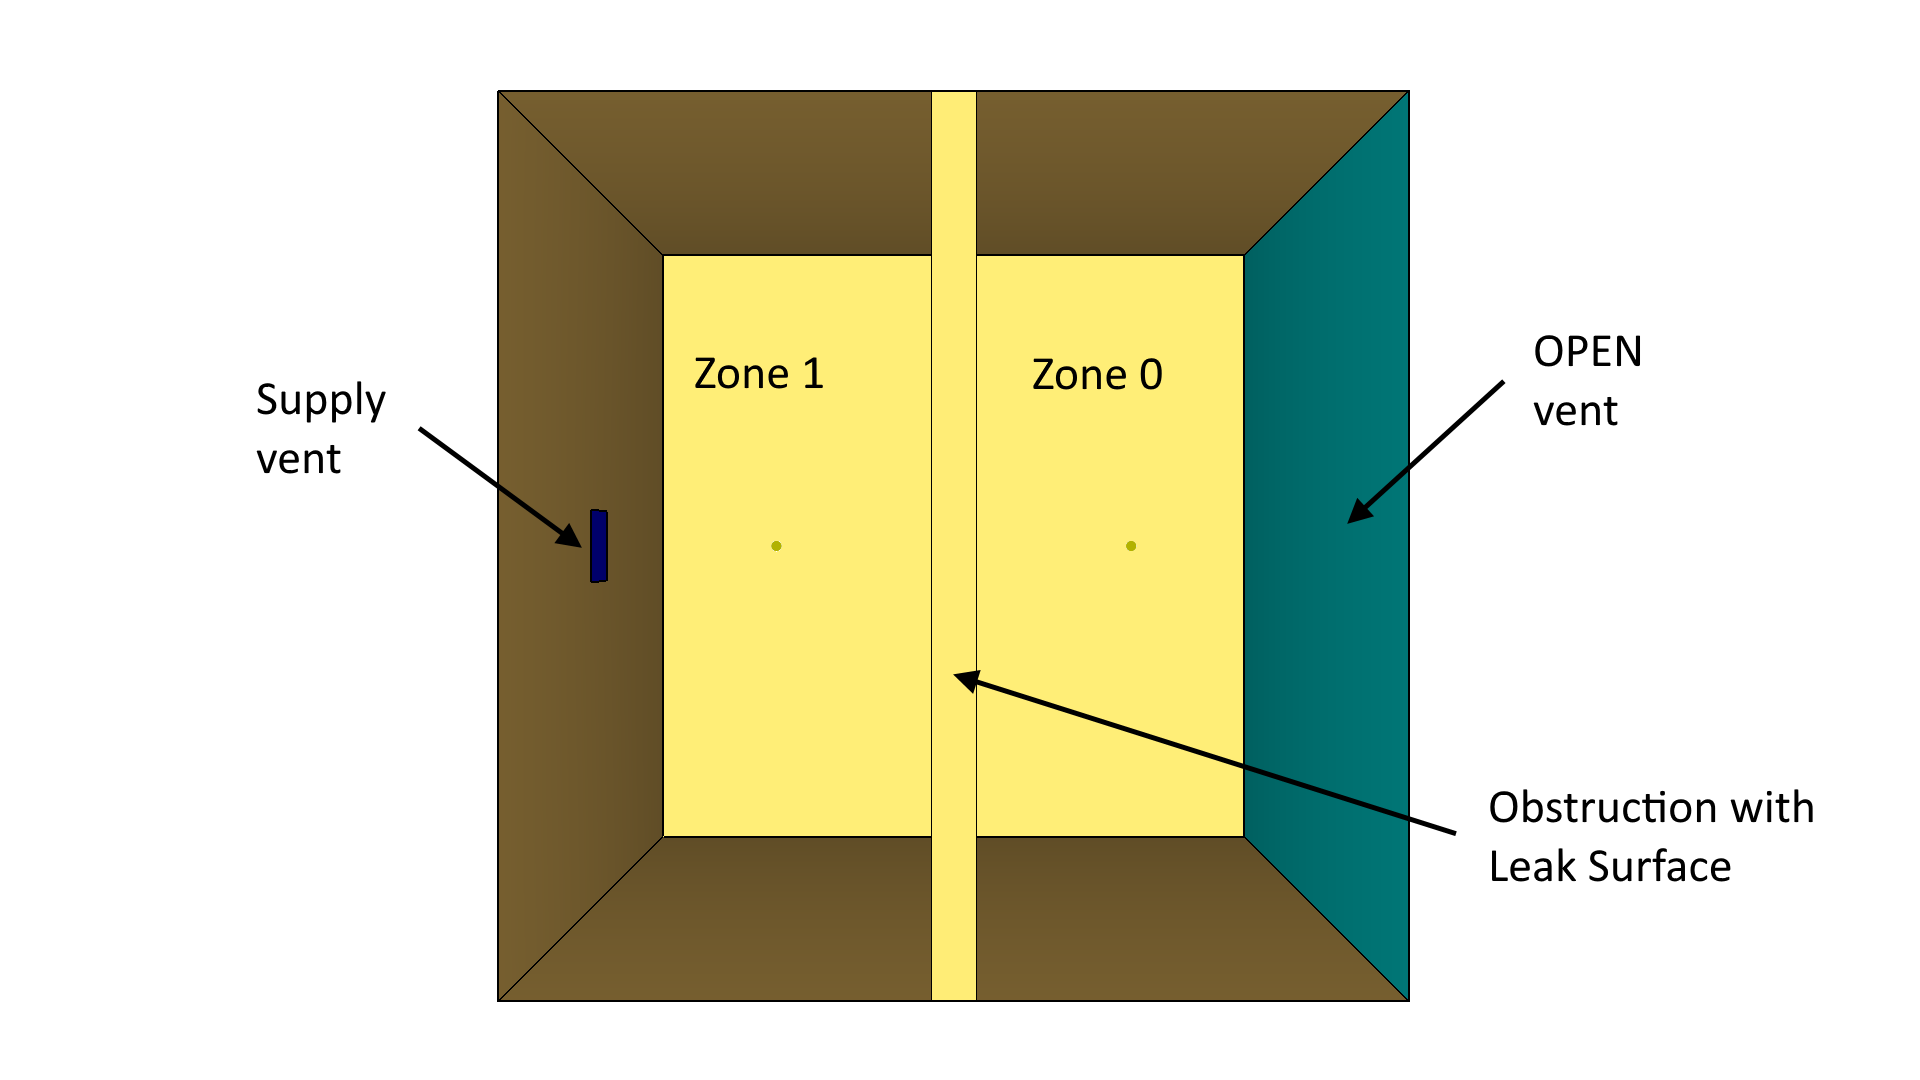
We will use the model shown in Figure 4 to illustrate. Pressure zone leakage is defined in three steps:
- Define the zones.
- Define a leak surface.
- Apply the leak surface to a solid with boundaries in both zones.
Pressure zone leakage is supported in the PyroSim graphical interface. The following steps were used to create the model shown below.
- Define Zone 1 (draw with the tool or double-click Zones in the tree). This is an enclosed zone bounded by INERT surfaces and an obstruction. Specify the leak area.
- Create a Leak surface. The Surface Type is Air Leak. Specify the Leak Path between Zone 1 and Zone 0 (the default outer zone).
- Create an obstruction that uses the Leak surface.
In this example, air is aupplied at a rate of 1 kg/s through a 1 m2 vent.
The leakage area is 0.1 m2.
Then air flows through the obstruction to the OPEN boundary.
Since the flow rate is known, the expected pressure drop can be calculated using equation 9.6 in the FDS User Guide:
The calculation in Zone 1 reaches a steady state value that matches expected value.
Localized Leakage
As described in the FDS manual, "The local leakage approach is intended to represent leakage through a specific crack. For example, a cracked open door might have a opening that is too small to resolve with the grid. One would; however, still want to capture the fact that hot gases could escape the top of the crack and cold gases enter the bottom." (McGrattan et al. 2021)
As shown in Figure 5, we will first use a variation of the previous model to illustrate localized leakage.
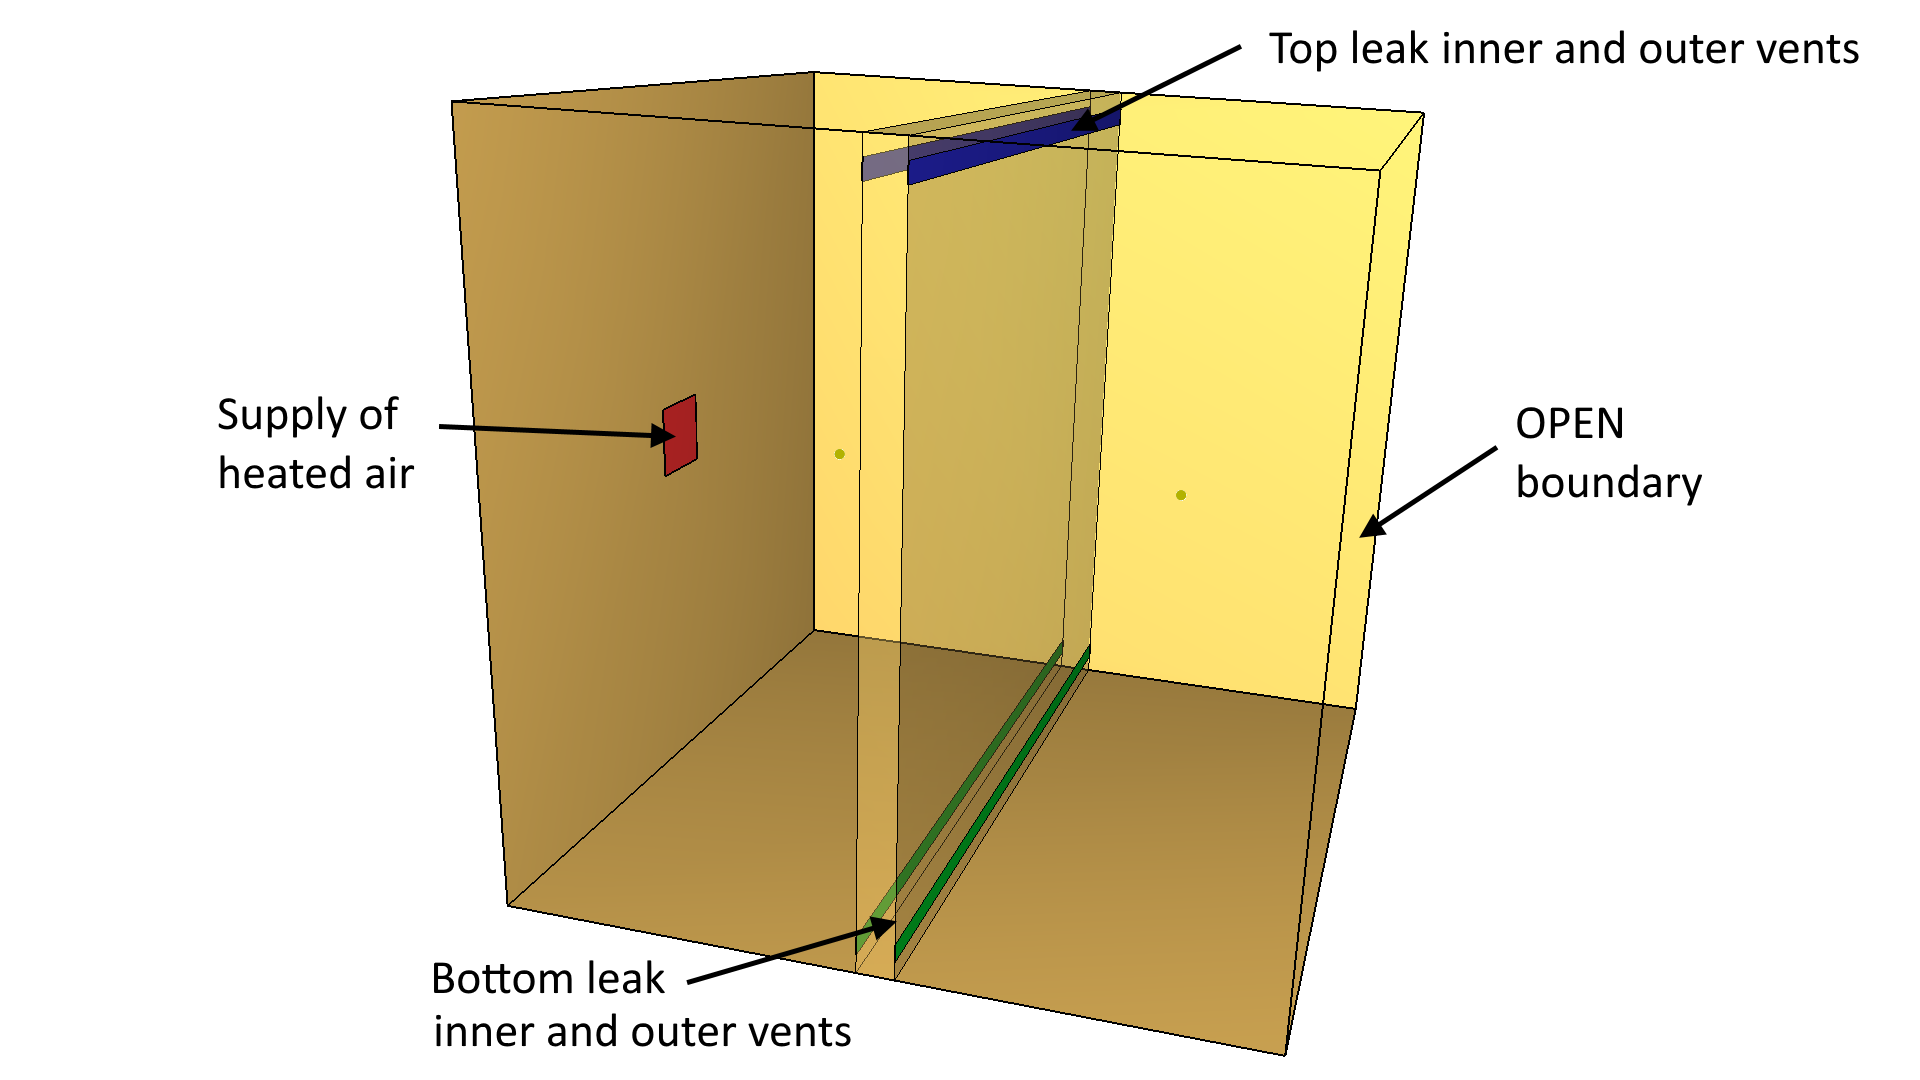
Use the following steps to create this model:
- Define Zone 1. The Leak Area between Zone 1 and Zone 0 is zero.
- Create the obstruction between the zones.
- Define the inner and outer vents at the top and bottom of the obstruction.
- Create a new HVAC component of type LEAK that connects the inner and outer top vents.
Specify the Leak Area as
0.1 m2. Click Enable Leak Enthalpy. - Repeat and make an HVAC component of type LEAK that connects the inner and outer bottom vents.
Specify the Leak Area as
0.1 m2. Click Enable Leak Enthalpy.
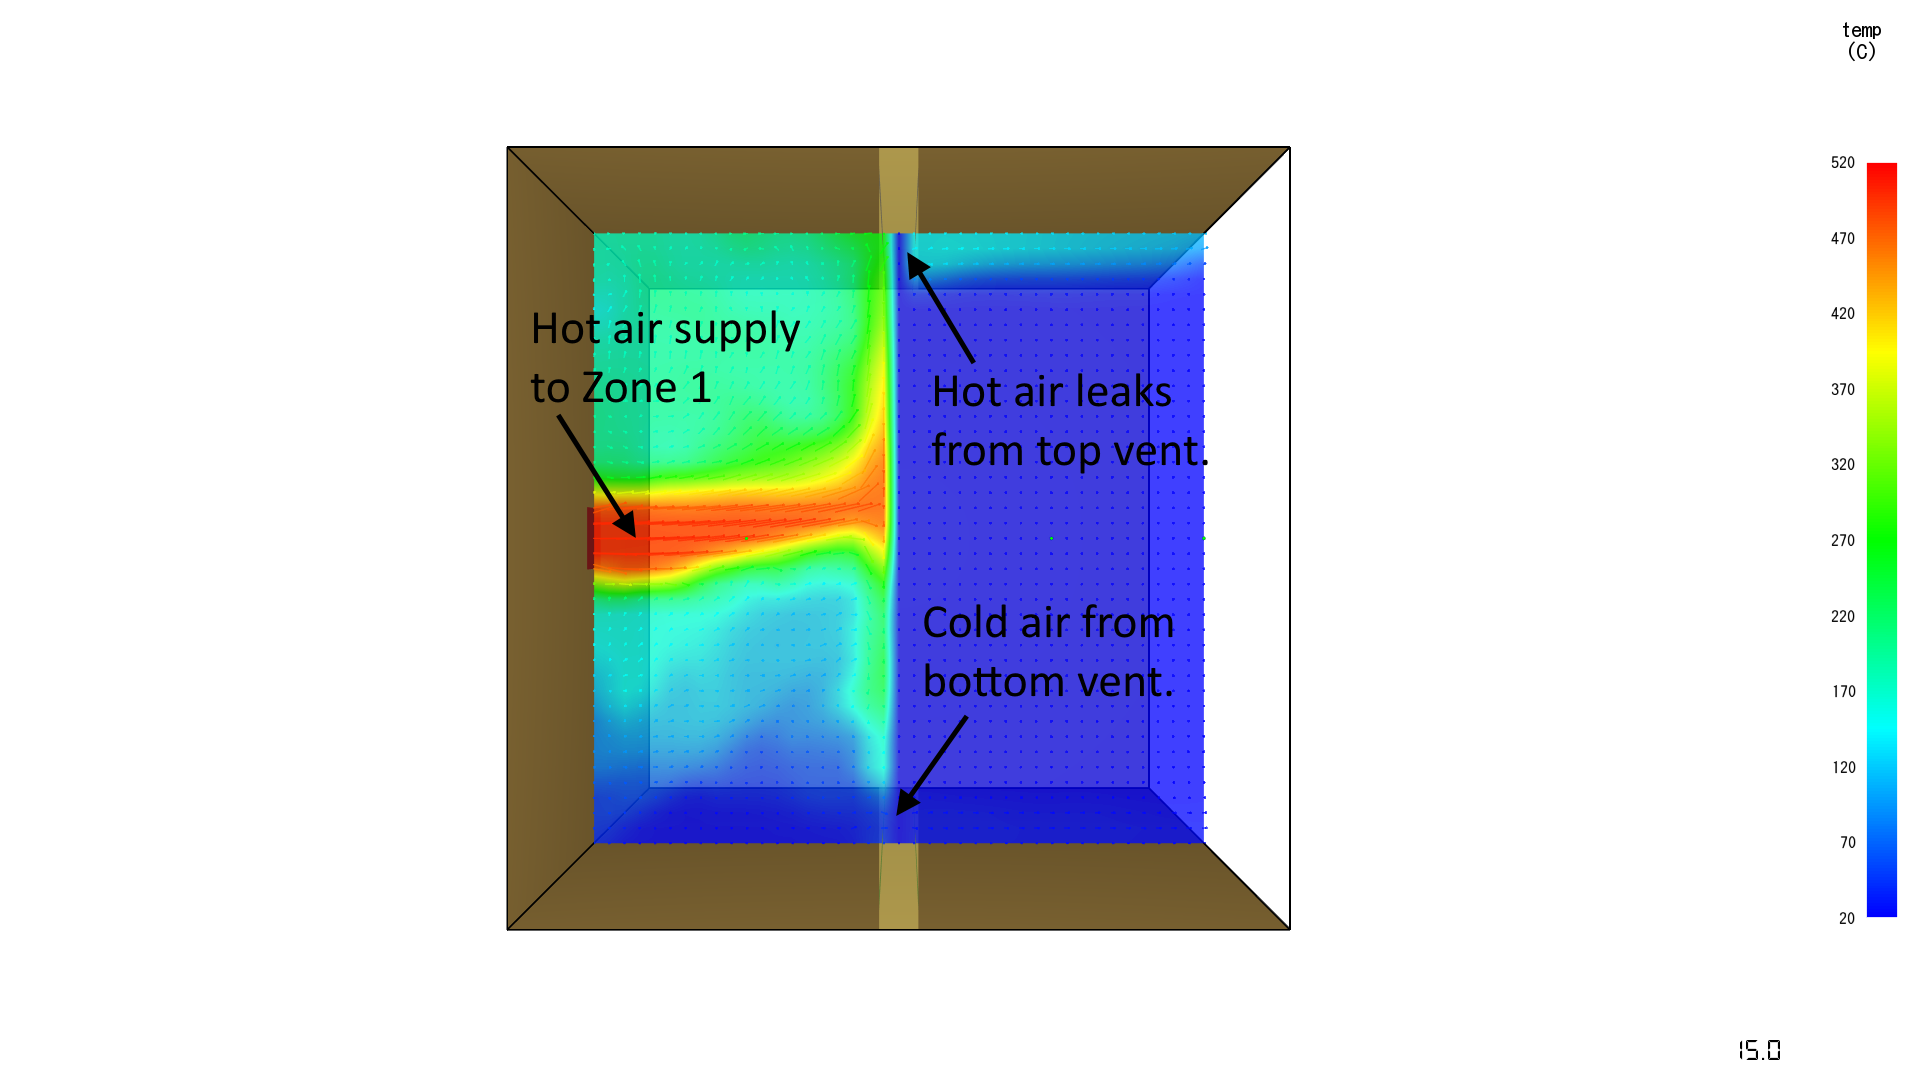
The results for this case are shown in Figure 6. At first, the hot air in Zone 1 rises and the flow into Zone 0 has hot air only at the top. When Zone 1 becomes filled with hot air, the air at the bottom vent is also hot.
FDS Verification Example leak_test_2
Figure 7 shows the leak_test_2 model described in the FDS Verification Guide.
"Two compartments (each 0.9 m by 1 m by 1 m) are connected by a small fan and a leak at the floor. A second leakage vent is added to the floor of the discharge side of the fan. This vent leaks to the ambient. When the simulation starts the fan pushes air from one compartment to the other. As the pressure rises, the leakage increases until the leakage flow rate is equal to the fan flow rate. Since some air from the interior compartment is being discharged to the ambient, the average pressure of the two compartments decreases until the pressure of the interior compartment is equal to that of the ambient. At this point in time, there is no more leakage to the outside and the fan flow rate equals the leakage flow rate between the two compartments."
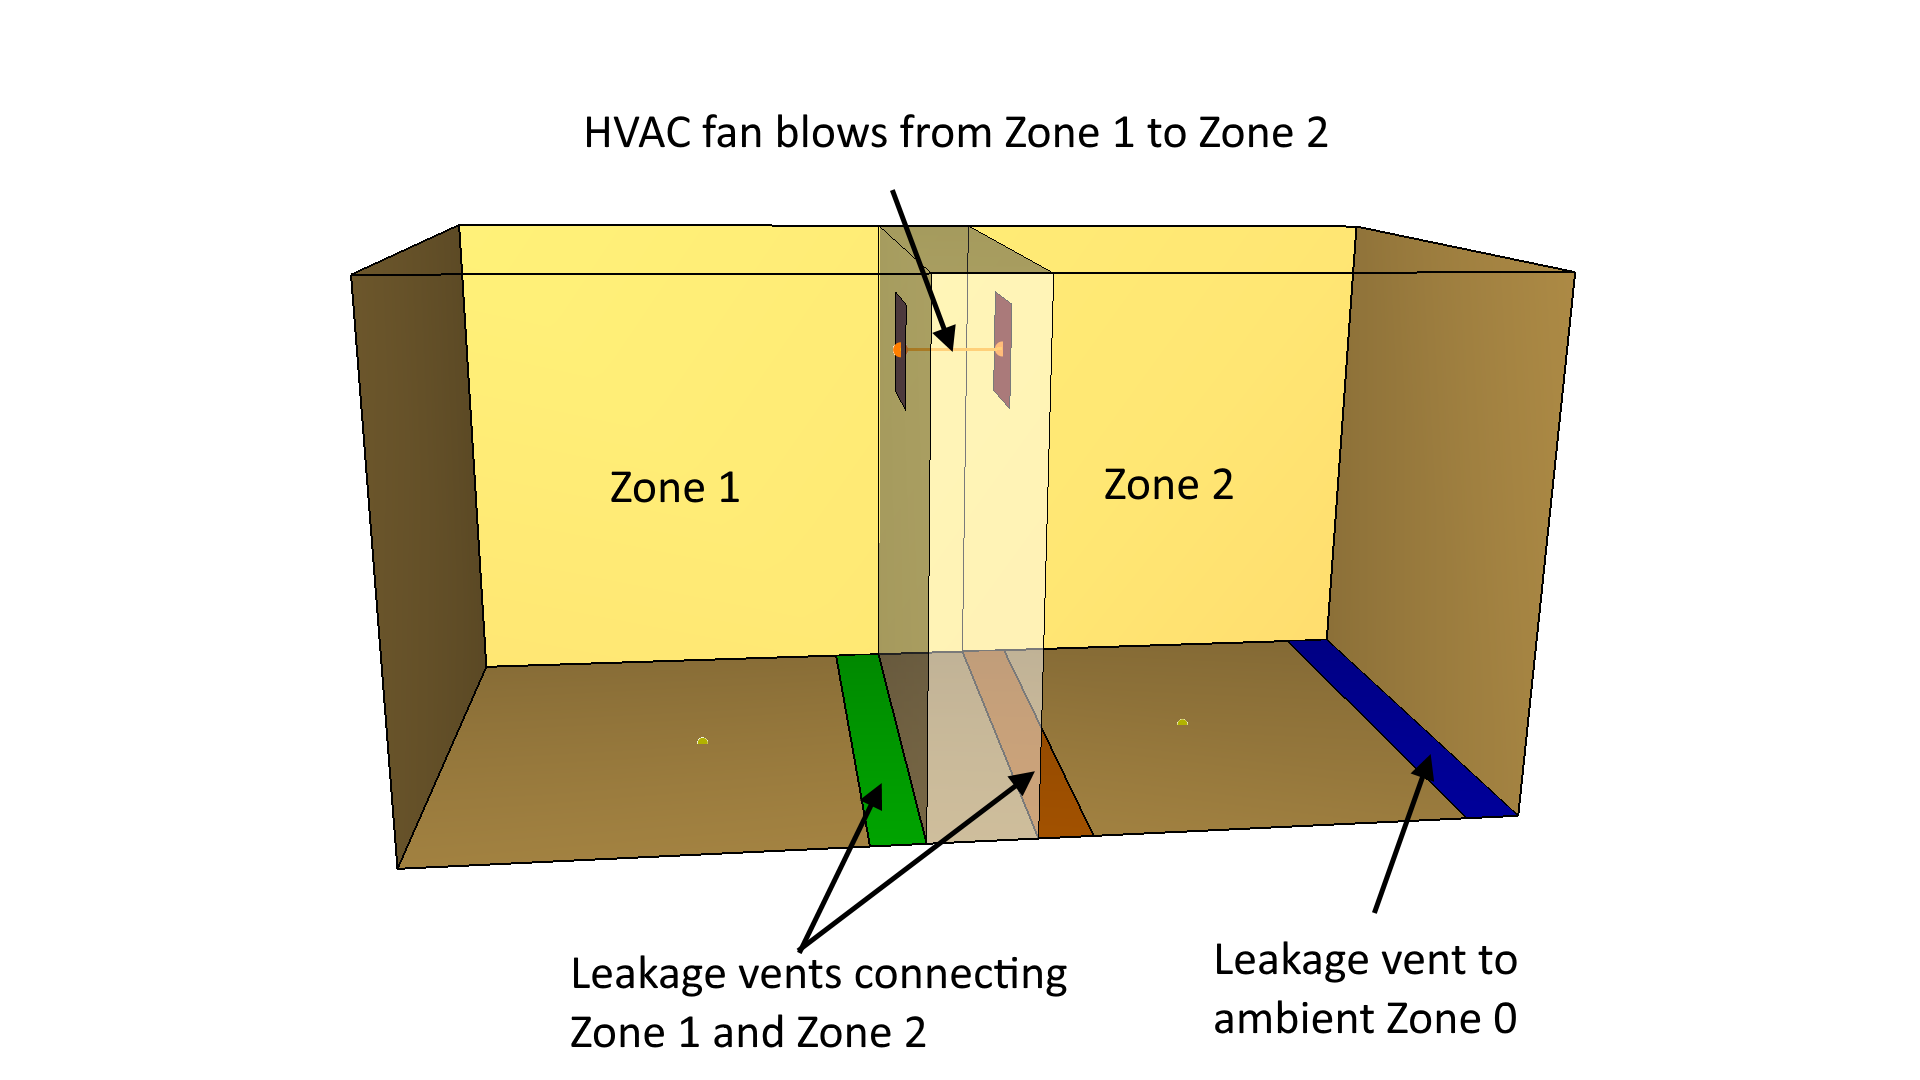
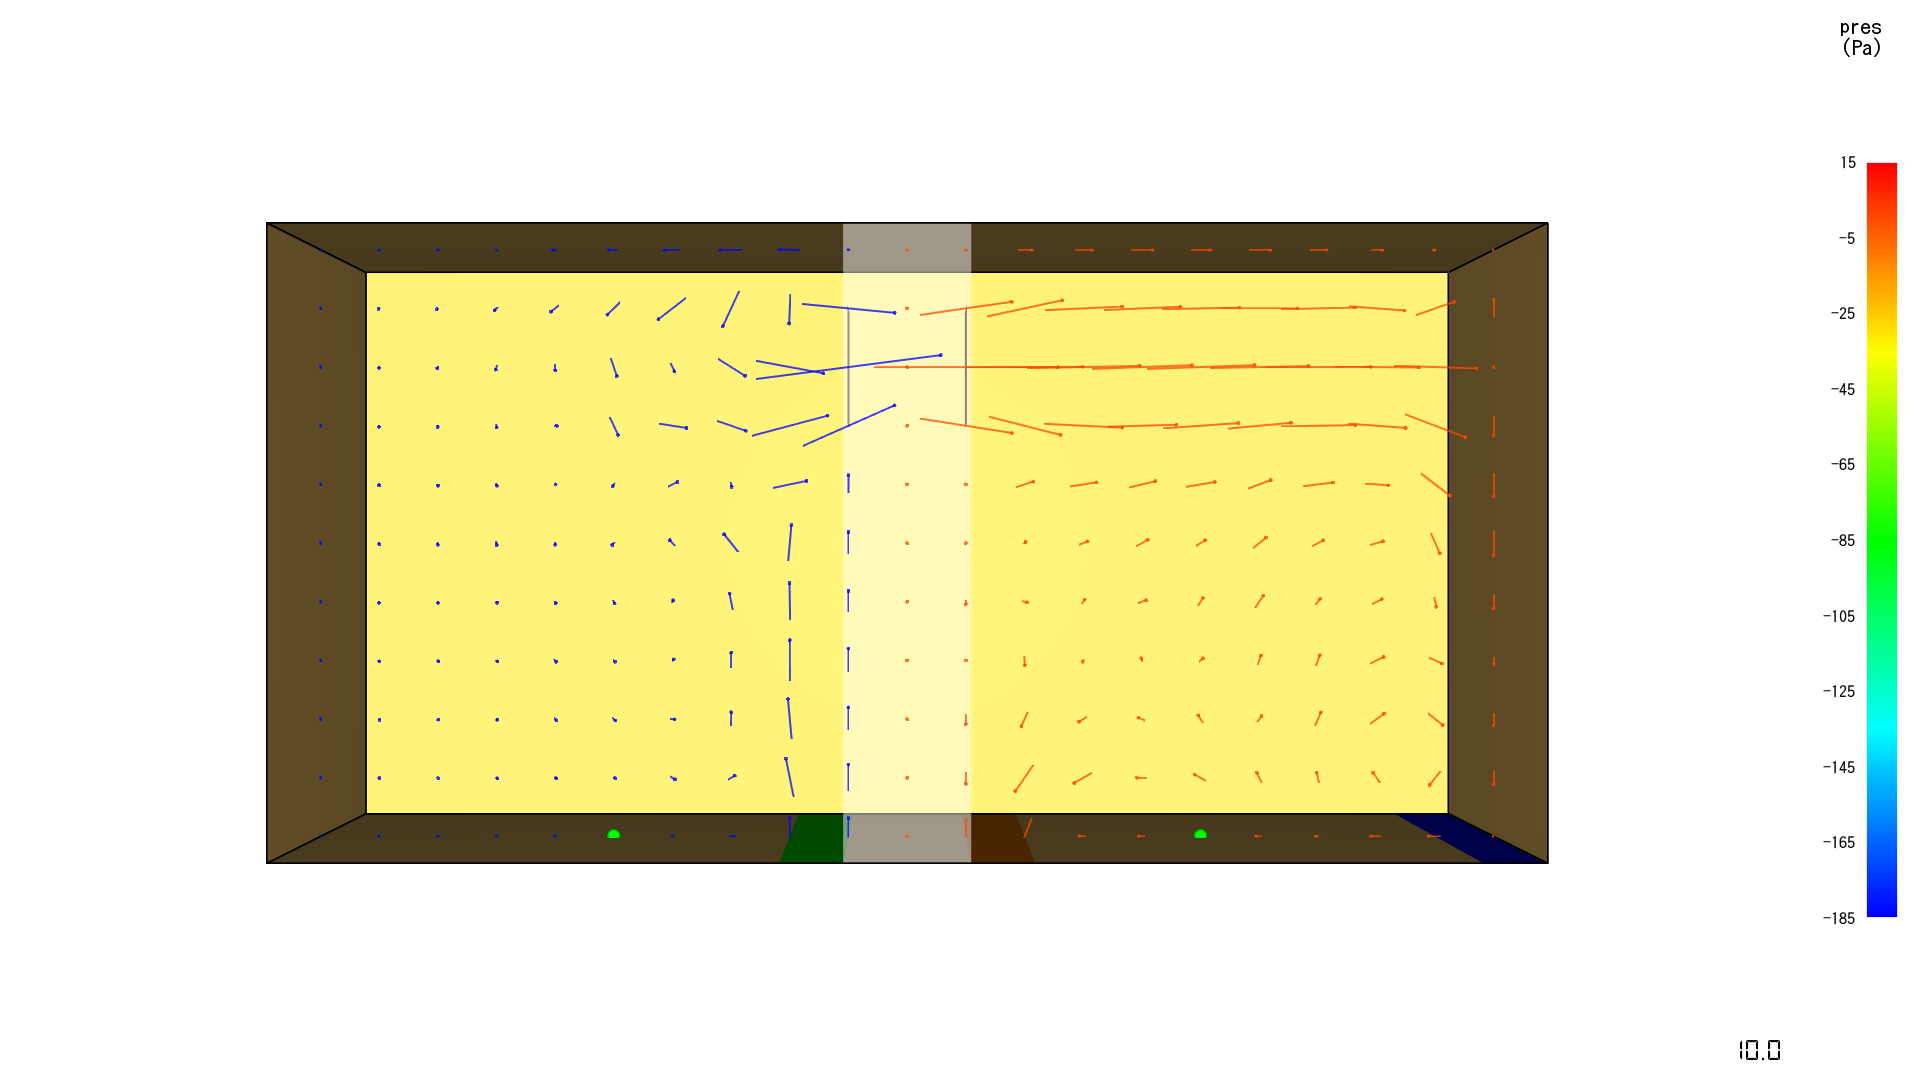
Figure 8 shows the pressure vectors at 10 s.
The color of the vectors corresponds to the pressure and the vectors display the velocity.
FDS Verification Example door_crack
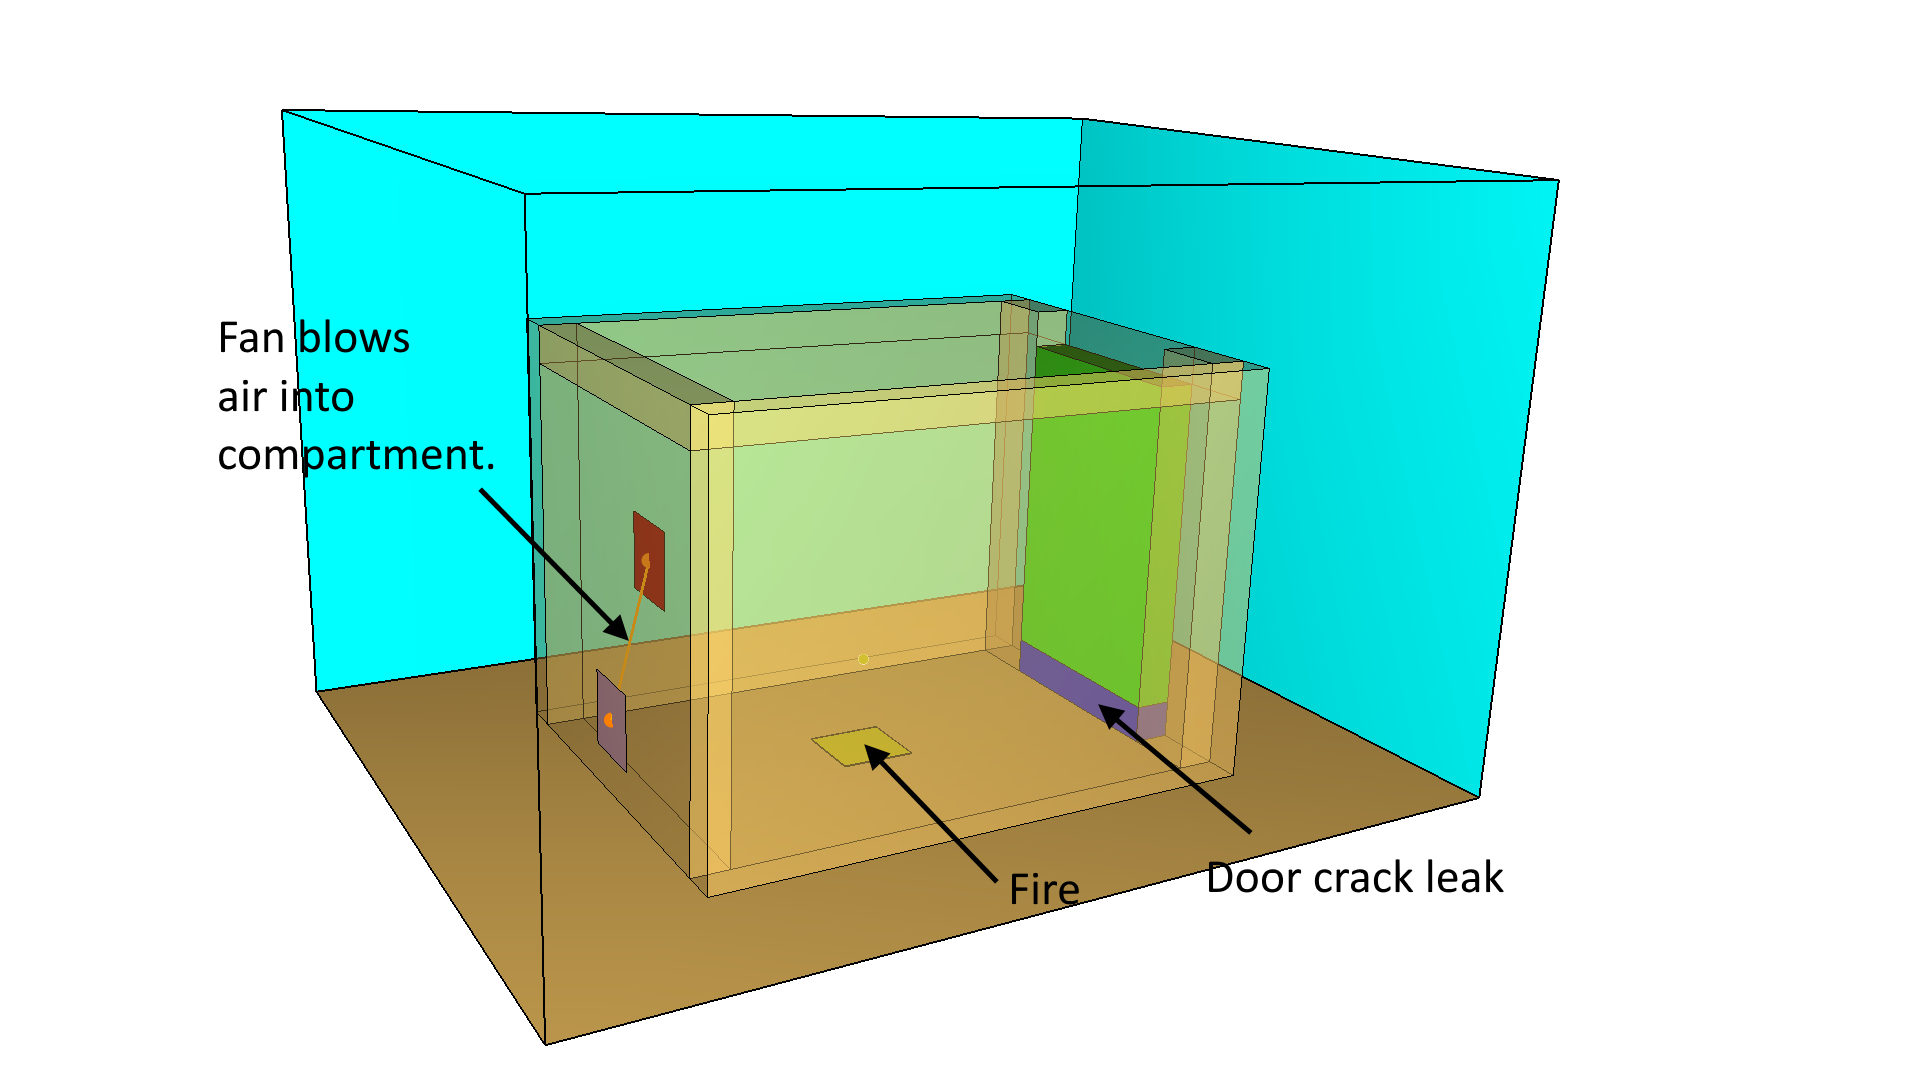
Figure 9 shows the door_crack model described in the FDS User Guide and available as a verification problem.
"This example involves a small compartment that contains a fan in one wall and a closed door with leakage at its bottom in the opposite wall. A small (160 kW) fire is added to the compartment. Initially, the pressure rises due to the heat from the fire and the fan blowing air into the compartment. Eventually the pressure rise inside the compartment exceeds the maximum pressure of the fan, at which point the compartment begins to exhaust from both the fan and the leakage. Pressure will continue to rise due to the fire until the pressure relief due to leakage and back flow through the fan equals the pressure increase from the fire." (McGrattan et al. 2021)
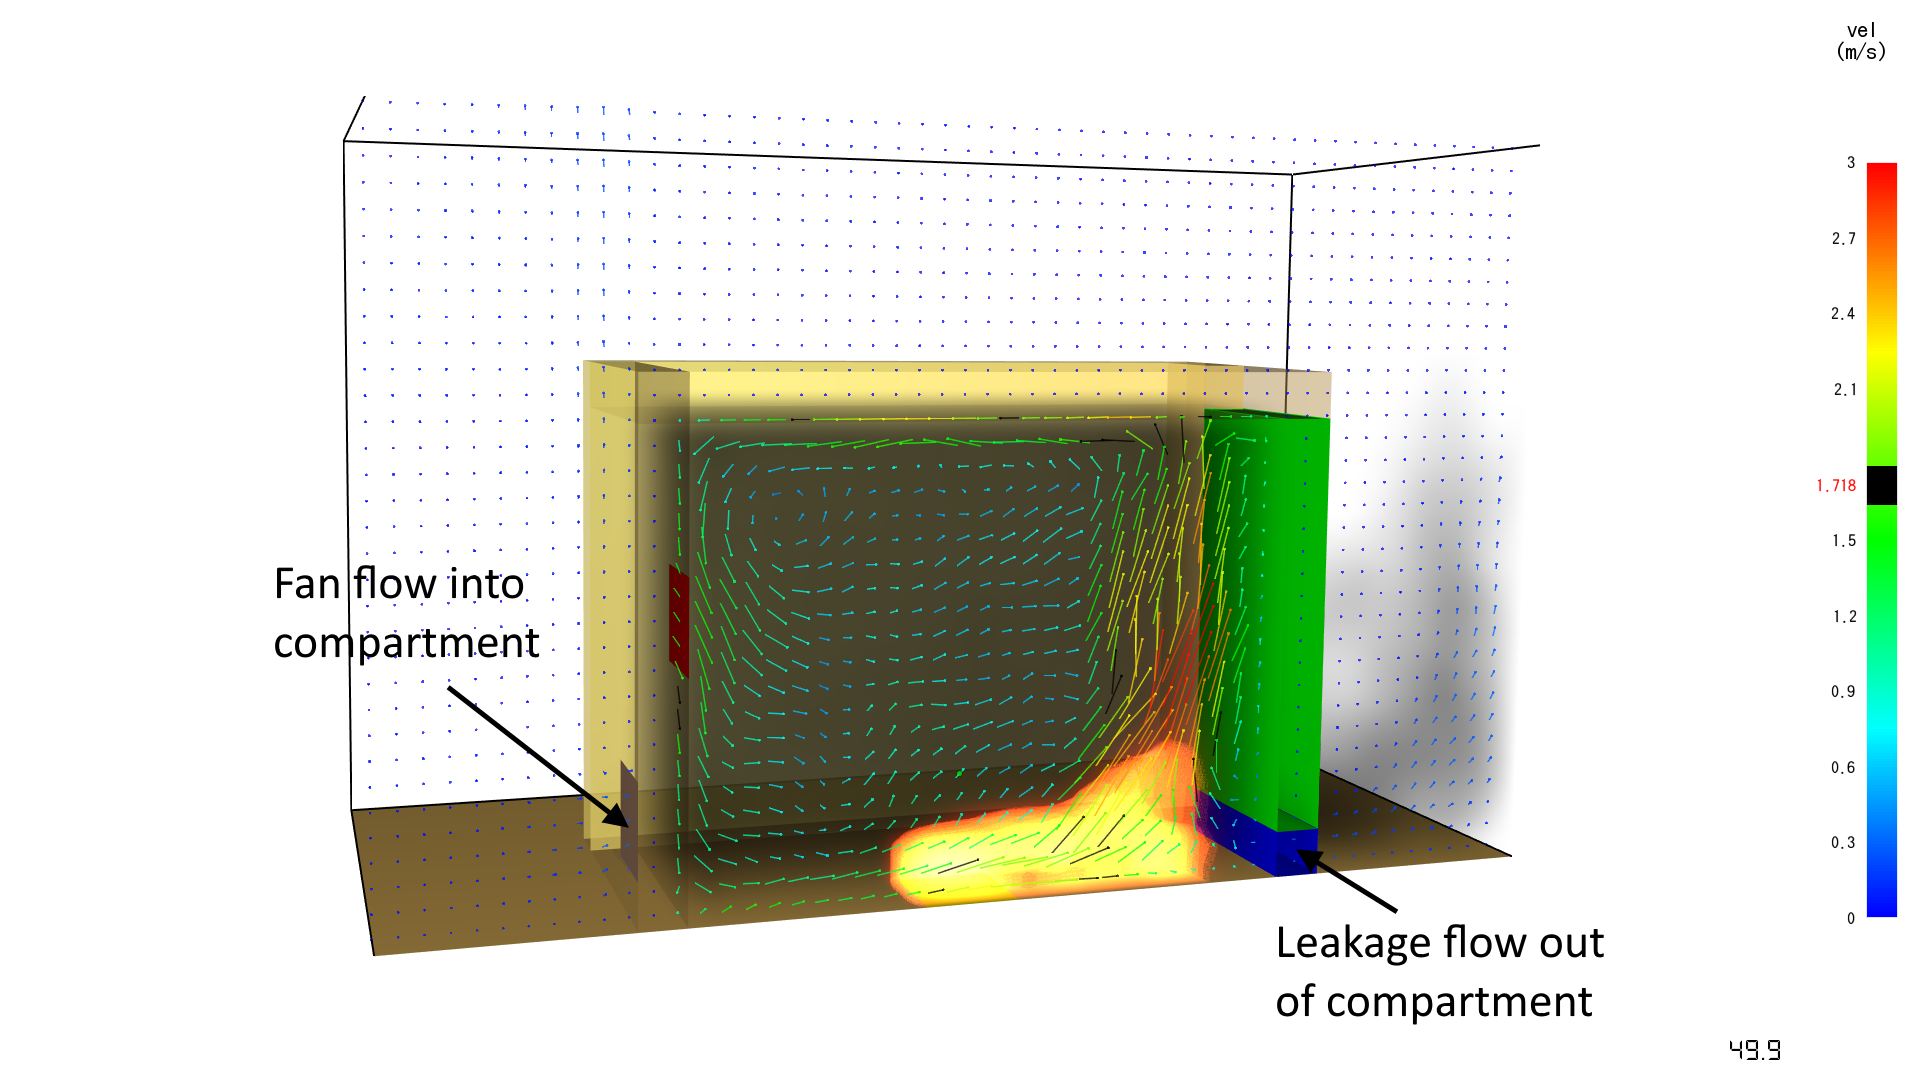
Results at 50 s are shown in Figure 10.
At this time, the fan is blowing air into the compartment.
At later times, compartment air flows out both through the fan and the leak.
To download the most recent version of PyroSim, please visit the the PyroSim Support page and click the link for the current release. If you have any questions, please contact support@thunderheadeng.com
Bibliography
McGrattan, Kevin, Simo Hostikka, Randall McDermott, Jason Floyd, and Marcos Vanella. 2021. Fire Dynamics Simulator User’s Guide, NIST Special Publication 1019. Sixth Edition. National Institute of Standards and Technology, Gaithersburg, Maryland, USA: NIST.
Related Tutorials
(Legacy) Tutorial to experience the fundamental features of PyroSim
Video tutorial demonstrating how to fix geometry problems related to DWG importation.
In this tutorial we show how to fix three problems that can occur when BIM (Building Information Modeling) or CAD (Computer-Aided Design) models into Pathfinder.
Tutorial demonstrating how to model a pressure relief vent in Pyrosim.
Tutorial to experience the fundamental features of Pathfinder
Video tutorial demonstrating how to avoid creating unwanted gaps in the geometry of a Pathfinder model.
Tutorial demonstrating how to import IFC files to Pathfinder.
Tutorial demonstrating how to model ramps three different ways and how to import sketchup geometry in PyroSim.