To follow along with this tutorial, download the relevant files here.
Introduction
Merve Altay contacted us with a tunnel model that was experiencing a numerical instability. He was simulating a set of experiments performed to evaluate the critical velocity in a tunnel fire. Answering his question eventually led to improvements in FDS and a better understanding of user applications of PyroSim and FDS.
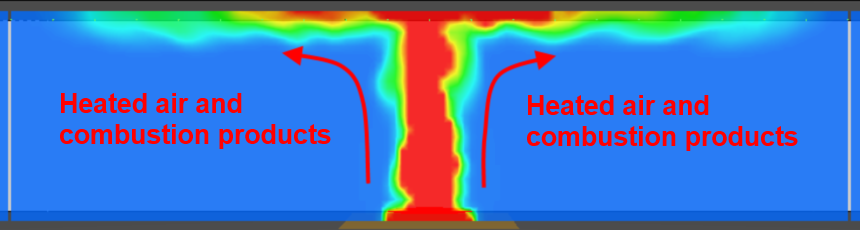
In the event of a fire in a tunnel, smoke and heated combustion products rise to the top of the tunnel and spread laterally.
The NFPA 502 Standard for Road Tunnels, Bridges, and Other Limited Access Highways (NFPA 2020) defines the critical velocity as "The minimum steady-state velocity of the ventilation airflow moving toward the fire, within a tunnel or passageway, that is required to prevent backlayering at the fire site."
NFPA 502 provides two equations, solved simultaneously by iteration, that can be used to calculate the critical velocity.
where: \(V_{c}\) is the critical velocity (m/sec), \(K_{1}\) is the Froude number factor (0.606), \(K_{g}\) is the grade factor (1 for level), \(g\) is gravitational acceleration (m/sec2), \(H\) is the height of the tunnel (m), \(Q\) is the heat that the fire is adding to the air (kW), \(\rho\) is the density of the upstream air (kg/m3), \(C_{p}\) is the specific heat of air (kJ/kg K), \(A\) is the tunnel area (m2), \(T_{f}\) is the average temperature of the fire site gases (K), and \(T\) is the temperature of the approach air (K).
You can download a Tunnel Critical Velocity spreadsheet here that performs this calculation.
Experimental Data
The experiments Merve Altay was simulating are described in the paper Study of critical velocity and backlayering length in longitudinally ventilated tunnel fires (Li and Ingason 2010).
In particular, Altay was modeling Tunnel A which had a 250 x 250 mm square cross-section with a 12 m length and was made from 1 mm thick stainless steel.
The fire source was a 100 mm diameter porous burner using propane as the fuel.
The backlayer length was determined by measuring the gas temperature below the tunnel ceiling.
The experimental results are shown below, including the corresponding NFPA 502 calculation.
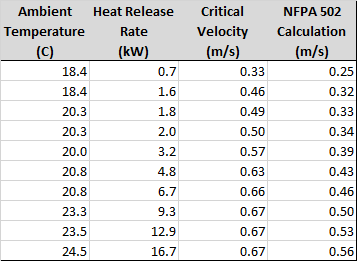
As can be seen, there is a general correlation between the scaled model experiments and the NFPA 502 calculations, with the NFPA 502 calculations predicting somewhat lower critical velocities. In addition to the NFPA 502 equations, the Li et al. paper does provide other correlations of the experimental data.
Simulation
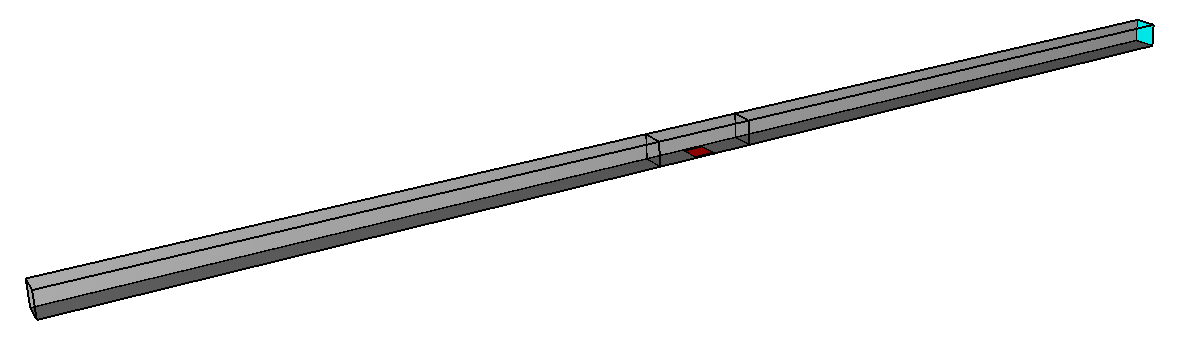
Merve Altay’s model is shown in Figure 4.
The ventilation velocity is defined at the inlet and an open boundary condition is used at the exit.
The fire uses a circular vent geometry, with the heat release rate (HRR) calculated to give the desired experimental value.
The mesh at the central fire region uses cell sizes of 0.0083 x 0.0083 x 0.0083 m.
The inlet and outlet meshes have dimensions of 0.0167 x 0.0183 x 0.0167 m.
For a HRR of 2.0 kW, D*/10 gives a mesh size of 0.0080 m, so it is expected that the mesh in the fire region is adequate to simulate the fire, but this has not yet been confirmed by a mesh size study.
Numerical Instability
When using FDS 6.4.0, the solution resulted in a numerical instability error. Merve Altay reported this to the NIST Issue Tracker and Kevin McGrattan at NIST identified the problem as related to the calculation of the baroclinic torque term in the momentum equation (see issues 3794 and 3807). The approximation used in FDS 6.4.0 is satisfactory for most geometries, but could fail in long, sealed tunnels.
To improve the calculation, McGrattan implemented "an iterative scheme such that we iterate the "baroclinic term", p grad (1/rho), in the current pressure iteration scheme that we use to force the pressure and velocities to match at mesh boundaries." This appears to solve the problem and, if confirmed after further testing, will be included in the next release of FDS.
FDS Critical Velocity Calculation
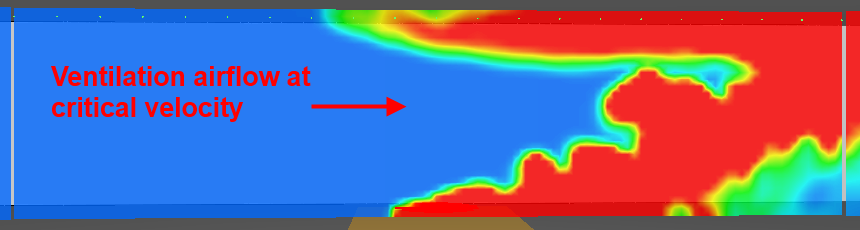
Using the new FDS with the improvement, some calculations of critical velocity for the scale model tunnel have been completed. The figures below show the results for temperature contours for three different ventilation flow rates. The location of the temperatures can be used to identify the length of backlayering.
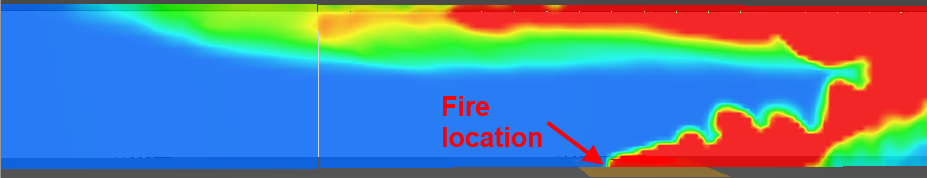
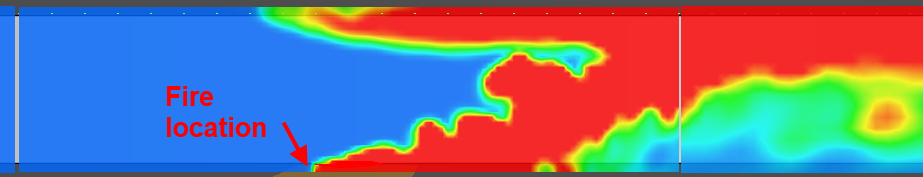
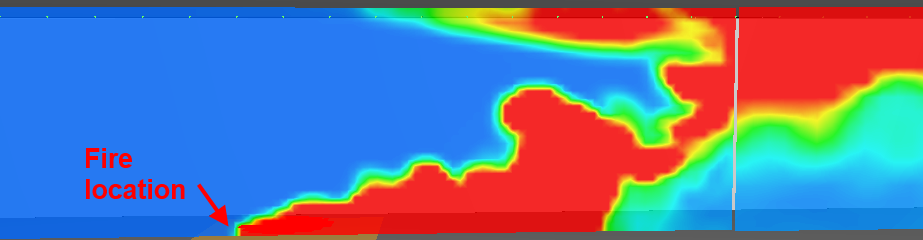
These results indicate that the calculated FDS critical velocity for this case is between 0.6 m/s and 0.7 m/s.
The experimentally measured value was 0.67 m/s so there is good correlation between the FDS calculation and the experiment.
Additional Comments
Section 6.6.2, Pressure Considerations in Long Tunnels in the FDS User Guide discusses the role of PRESSURE_TOLERANCE and MAX_PRESSURE_ITERATIONS in solving tunnel problems. By default, the PRESSURE_TOLERANCE is 20/δx 2 where δx is the characteristic grid cell size and MAX_PRESSURE_ITERATIONS has a default value of 10. In response to a user question where smoke was not smoothly crossing mesh boundaries, we experimented with reducing the PRESSURE_TOLERANCE value by a factor of 16 and setting the MAX_PRESSURE_ITERATIONS to 50. This resulted in a stable and smooth solution.
Acknowledgements
The tunnel model and background information was provided by Merve Altay. Kevin McGrattan at NIST implemented a solution scheme that was successful in the long, sealed tunnel. All calculations were performed using the FDS and Smokeview software. PyroSim was used to create and run the FDS models.
To download the most recent version of PyroSim, please visit the the PyroSim Support page and click the link for the current release. If you have any questions, please contact support@thunderheadeng.com
Bibliography
Li, Ying, and Haukur Ingason. 2010. “Study of Critical Velocity and Backlayering Length in Longitudinally Ventilated Tunnel Fires.” Fire Safety Journal - FIRE SAFETY J 45 (November): 361–70. https://doi.org/10.1016/j.firesaf.2010.07.003.
NFPA. 2020. “NFPA 502 - Standard for Road Tunnels, Bridges, and Other Limited Access Highways.” National Fire Protection Association.
Related Tutorials
Tutorial demonstrating how to model jet fans in Pyrosim.
Tutorial demonstrating how to create and FDS Velocity Patch in Pyrosim.
Tutorial demonstrating how to verify HVAC Pressure Drop in Pyrosim.
Tutorial demonstrating how to use PyroSim/FDS to Maximize Solar Panel Convective Cooling.
How to simplify post-processing data collection with seasonal scenarios and scheduled stairwell temperatures.
Tutorial Comparing FDS results to fire spill-plume calculations in BRE Annex D.
Evacuation simulation of a center-platform station using Pathfinder, then comparing results with NFPA 130 and SFPE calculations.
(Legacy) Tutorial to experience the fundamental features of PyroSim