Overview
This is the second tutorial in our PyroSim Fundamentals tutorial series, intended for new PyroSim users. In this tutorial, we will demonstrate how to add basic data outputs to your fire models and explain the basics of the underlying FDS concepts.
Before Starting
Before beginning this tutorial:
- Complete the Your First Fire tutorial.
- Download the files for this tutorial: Basic Data Output.
- Visit the latest version of the PyroSim User Manual for reference throughout this tutorial.
- Download the latest version of the FDS User’s Guide from the NIST FDS-SMV Manuals page.
Once you have the Basic Data Output zip file downloaded and unzipped:
- Open the my_first_model.psm PyroSim model
- Click File > Save As
- Give the model the name
basic_data_output.psm - Click Save
Introduction
In the Your First Fire tutorial, you created your first functional fire model. This model included Obstruction geometry and a basic fire. When run, it generated the standard simulation outputs created by every FDS simulation. However, in most modeling cases this is not enough data to answer the questions you may have. To create more data with your model, you will need to define some additional outputs in PyroSim.
There are many output types available in PyroSim and FDS, however this tutorial will cover two of the most commonly used: Devices and 2D Slices. For each of these, you will learn underlying FDS concepts, how to create the output in PyroSim, and how to view the results of the output in the Results viewer.
Devices
What are Devices?
Devices are very generalized tools in FDS, as defined in Chapter 20: Devices and Control Logic of the FDS User Guide (McGrattan et al. 2021). They can be used for a wide number of applications in your model. Some of these include recording quantities in the simulation and generating an output, modeling real-life sensors to track their activation state, and triggering other events in the model.
This tutorial will cover the first two of these applications, and a later tutorial in the Fundamentals series will cover the third. However, keep in mind that these are just the basic concepts necessary to get you acquainted with PyroSim and FDS.
Types of Devices
As can be seen from the Devices menu in PyroSim, there are many categories of Devices. PyroSim divides Devices into these categories to make defining Devices easier. For this tutorial, we will cover the following 3 categories of Devices:
- Gas-Phase Devices
- This device type allows you to measure and record a quantity (more on what those are in Defining Devices) in a gaseous cell, measured at the cell center. You can think of these devices as being used to measure while floating in the middle of the air in your model. They measure the quantity at the center of the cell that they are placed in, regardless of where in the cell they are placed.
- Solid-Phase Devices
- This device types allows you to measure and record a quantity in a solid cell, measured at a cell face. You can think of these devices as being used to measure on top of a solid surface. They measure the quantity at the center of the closest face of the cell that they are placed in.
- Smoke Detectors
- This specific Device type models a smoke detector. It has a number of parameters that allow you to control where the detector is placed, as well as how and when it activates.
Defining Devices
With background definitions out of the way, let’s get to actually making some Devices to generate outputs in this model. You will create 3 different Devices to answer the following questions:
- What is the temperature at head-height in the doorway?
- What is the ceiling temperature above the fire?
- When will a smoke detector in the corner of the room activate?
Defining a Gas-Phase Temperature Device
To figure out the temperature in the doorway, we will need to know the temperature of the air in one of the cells that make up the opening of the doorway. Because this doorway is a Hole, and the cells there are gaseous, we will use a Gas-Phase Device. To create this device:
- In the 3D View, select the Device tool.
- Right-click, then select Lock Z to snap location.
- Press the TAB key.
- Enter the XYZ location
0.08,2.5,1.75, then press ENTER.
- Double-click the new Device in the Navigation View to open the Gas-Phase Device dialog.
- Rename the Device to
Doorway Temperature. - Leave the Quantity set to the default
Temperature.
The Doorway Temperature Device is now fully configured.
Defining a Solid-Phase Wall Temperature Device
To figure out the ceiling temperature above the fire, we need to know the temperature at the bottom surface of one of the cells that make up the Ceiling obstruction.
Because we want to know the properties of a solid cell, we will need to use a Solid-Phase Device.
To create this device:
- In the 3D view, select the Device tool.
- Right-click, then select Tool Properties.
- In the Device Type dropdown, select Solid-Phase Device.
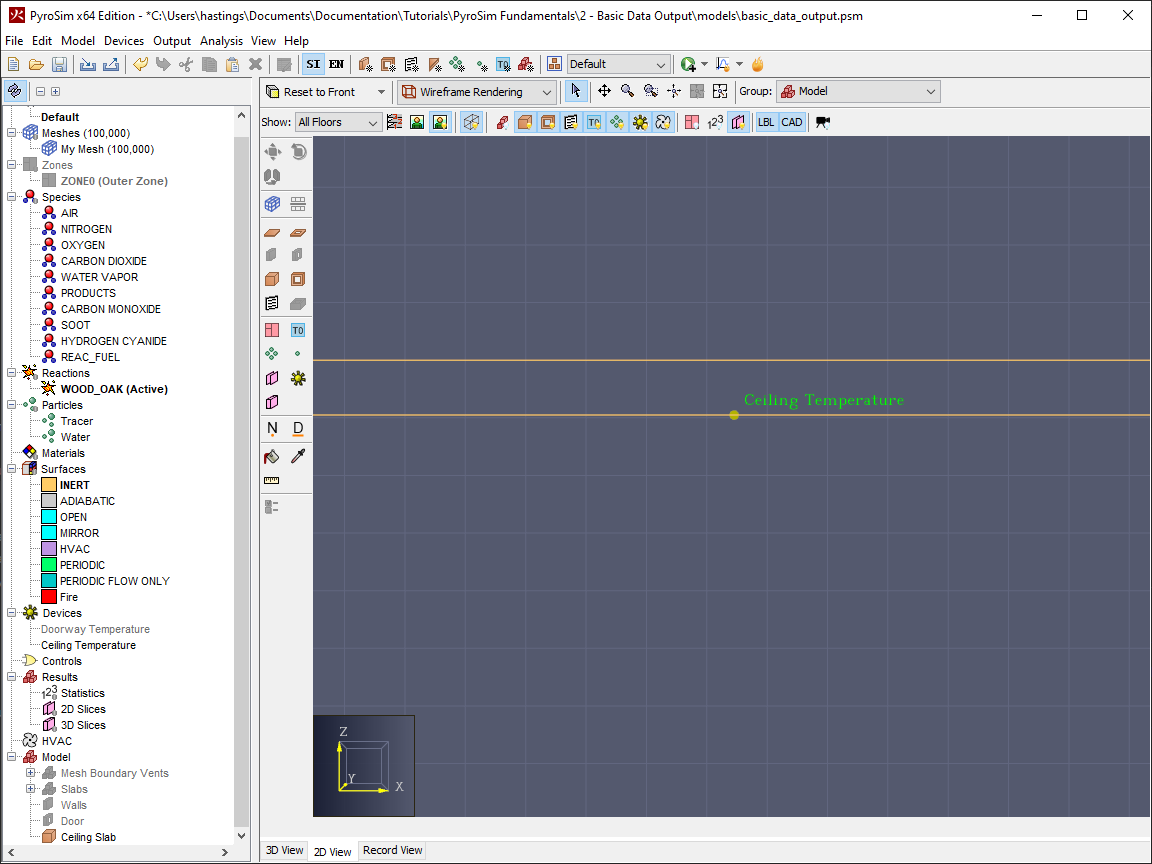
- Change the Name to
Ceiling Temperature. - In the Quantity dropdown, select Wall Temperature.
- Click OK to close the Tool Properties dialog.
- Press TAB to begin entering the device location.
- Enter the location
2.6,2.6,2.75. - Press ENTER to create the Device.
This Device you just created has an X and Y position that places it fully inside of a mesh cell on the ceiling above the Fire obstruction, shown in Figure 4.
This is done to avoid ambiguity in the final Device location.
We are telling FDS exactly which Mesh cell we want the Device in.
In Figure 4, you can see that if we positioned this device directly over the center of the Fire obstruction, it would be placed at the corner boundary of 4 different cells.
While FDS can handle this in most situations, it will essentially select a cell at random out of those 4 to place the Device in to.
Placing the device squarely inside of a cell lets us, as the maker of the model, know and control which cell is chosen.
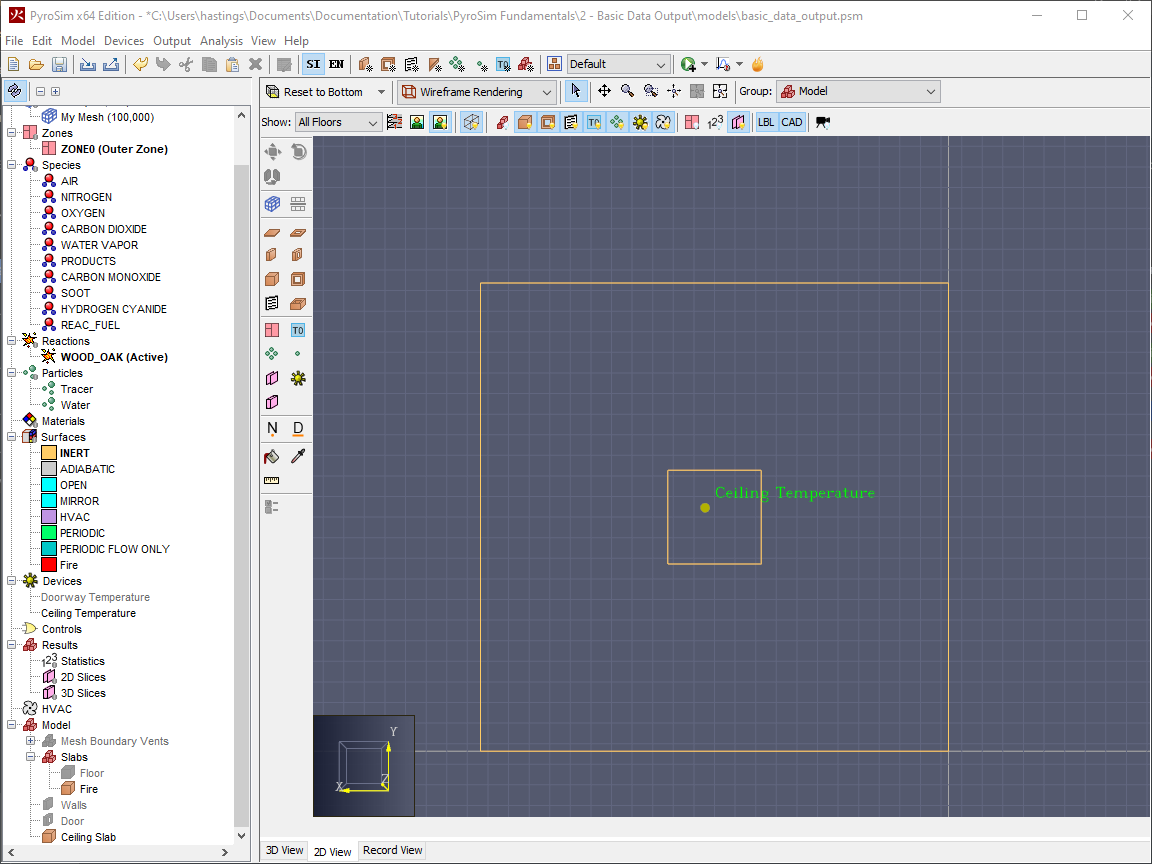
Like the X and Y coordinates, the Z coordinate is chosen to avoid ambiguity in the Device location.
The Z coordinate coincides directly with the bottom face of the Ceiling obstruction, shown in Figure 5.
The Ceiling Temperature Device is now fully configured.
Defining a Smoke Detector
To figure out when a smoke detector would activate in this fire scenario, we will need to add a device to our model to represent a smoke detector. Thankfully PyroSim has a built in Device Type for this. We will create a simple smoke detector in the model, using one of the built in smoke detector models provided in Table 20.1 of the FDS User Guide (McGrattan et al. 2021, 265). To add this smoke detector to the model:
- In the 3D view, select the Device tool.
- Right-click, then select Tool Properties.
- Change the Name to
Smoke Detector. - In the Device Type dropdown, select Smoke Detector.
- Leave the Model field set to Cleary Photoelectric P1.
- Click OK to close the Tool Properties dialog.
- Press TAB to begin entering the device location.
- Enter the location
4.37,0.63,2.635. - Press ENTER to create the Device.
The smoke detector you just created is located at the center of one of the cells at the corner of the room.
Smoke detectors are technically a type of Gas-Phase Device in FDS, so they need to be placed inside of a gaseous cell, just like the Doorway Temperature device created in Defining a Gas-Phase Temperature Device.
The Smoke Detector Device is now fully configured.
2D Slices
What are 2D Slices?
Think back to the questions we were looking to answer by adding Devices and think of what they all had in common. Whether it’s the temperature at head-height in the doorway, the temperature of the ceiling above the fire, or a smoke detector in the corner of the room, these questions are all looking for data at a single point. What if we want data for a broader area, and not just for a point?
That is where 2D Slices, also known as Planar Slices, come in to play. 2D Slices allow you to record the value of a Gas-Phase Quantity at more than just a single point by recording the value across an entire plane in your model.
Creating 2D Slices in PyroSim is fairly easy. You will create 3 different Slices to answer the following questions:
- What is the temperature across the entire doorway?
- What is the air temperature just below the ceiling?
- What is the visibility level in the room?
Defining 2D Slices
Defining 2D Slices in PyroSim is very easy. To create the Slices:
- Open the Animated Planar Slices dialog by using the Output > 2D Slices action.
This dialog shows a table. Each row in the table defines a separate 2D Slice. You define a 2D Slice by filling out a row in the table.
- Click the Insert Row button.
- In the new row, in the XYZ Plane dropdown, select X.
- In the Plane Value cell, enter
0.08m. - In the Gas Phase Quantity dropdown, select Temperature.
- In both the Use Vector? and Cell Centered? dropdowns, select NO.
The Slice you just defined will measure the Temperature in the plane of the doorway opening - the same plane that the Doorway Temperature Device is in.
Create the other two Slices:
- Insert 2 more rows into the table with the following information:
Z, 2.53m, TEMPERATURE, YES, NOZ, 1.75m, VISIBILITY, NO, YES
These Slices measure the temperature below the ceiling, and the visibility at head height, respectively.
The 2D Slices are now fully configured.
Viewing the Results
Run the simulation again, as in the Your First Fire tutorial, to re-calculate the results including the new Device and 2D Slice outputs.
Viewing Device Data
PyroSim provides a handy way to view the output data from Devices in your model.
By default, FDS writes the Device data out to a _model_name__devc.csv file.
PyroSim parses this, and other csv files, to provide ![]() Time History plots.
Time History plots.
To view the Time History plots for your Devices:
- Click the arrow next to the
 Time History plots icon, and select Plot Device Results.
The column on the left-hand side of the window is a list of all the devices in your model. The plot on the right is a plot of the value of the selected device over time. You can save a screenshot of your plot at any time by using the File > Image Capture action, which will save an image of the plot at its current size.
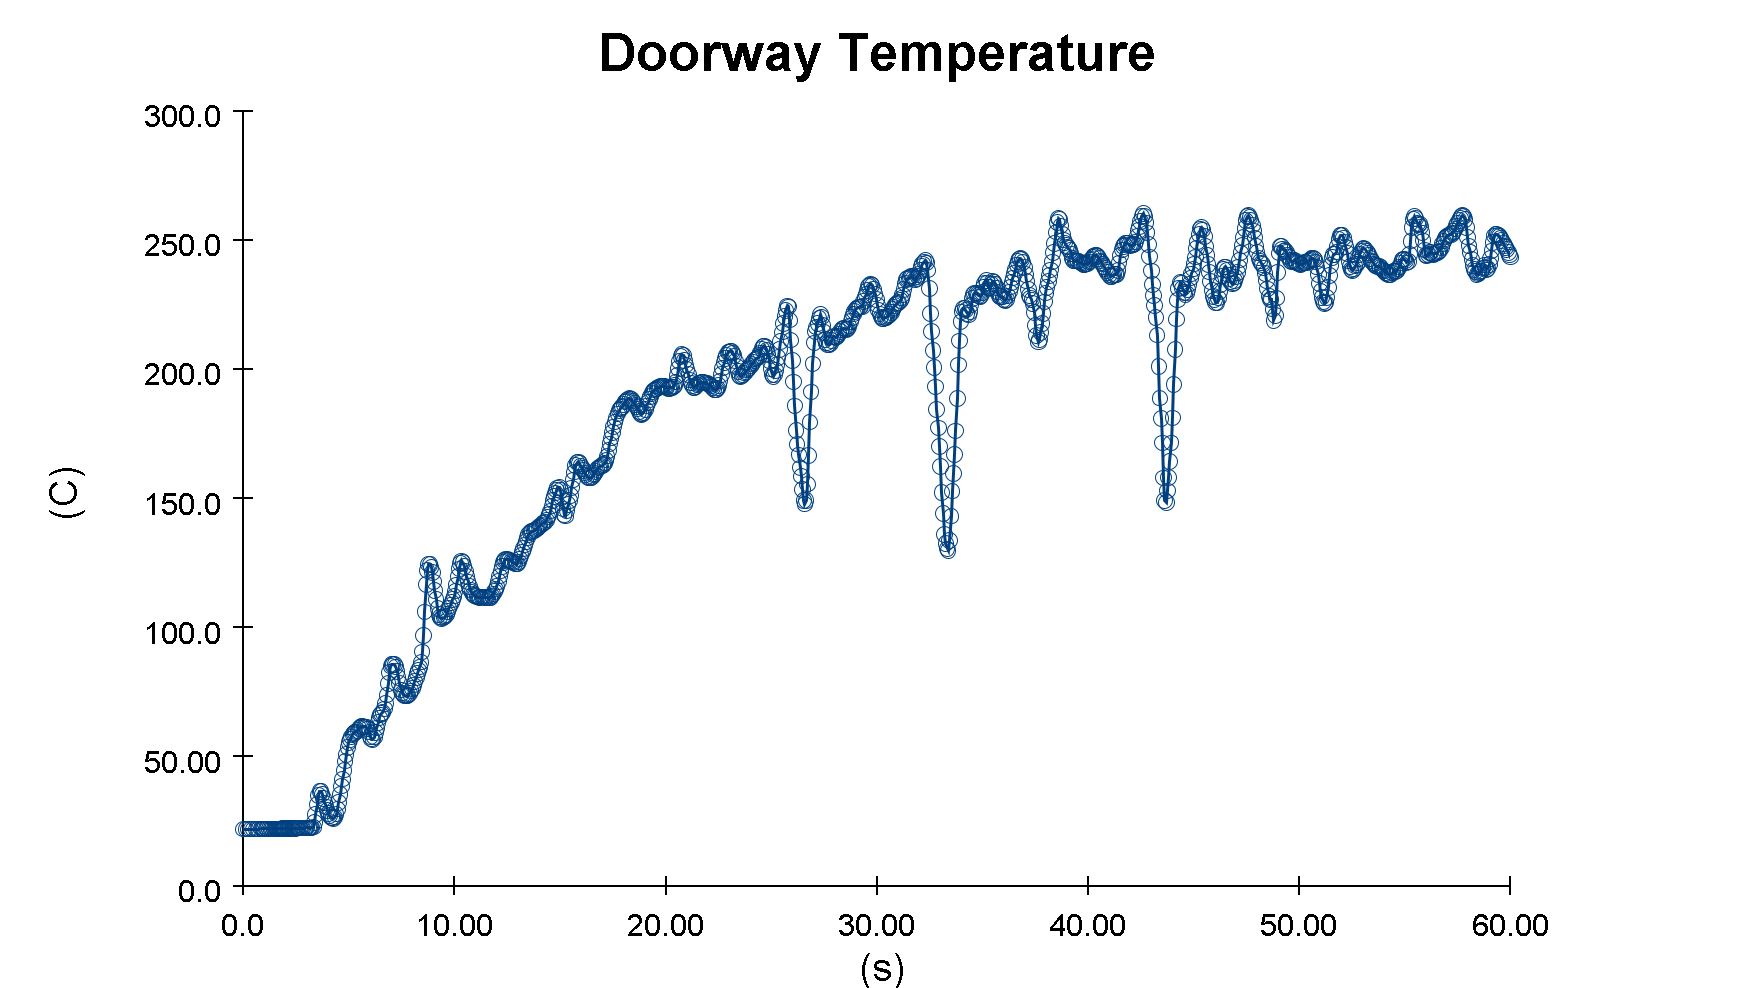
Viewing the Doorway Temperature plot in Figure 8, you can see that the maximum temperature achieved in the doorway is roughly 270°C, and this occurs around 48s.
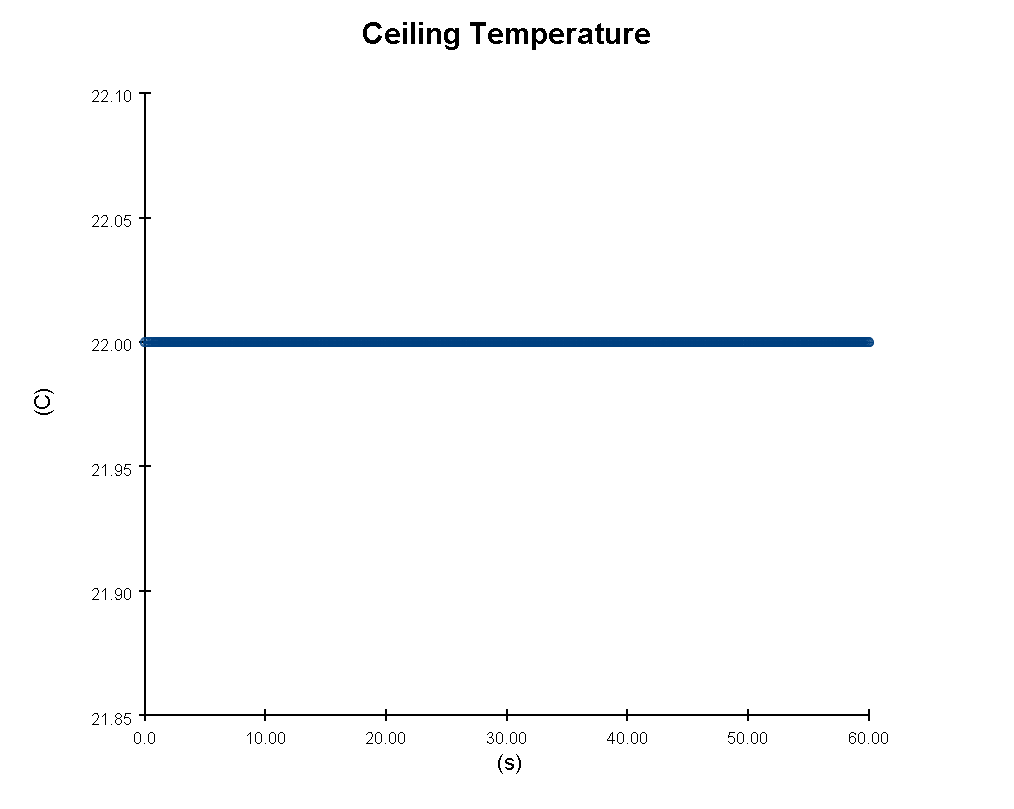
Figure 9 shows the plot of the Ceiling Temperature Device.
As you can see from the plot, the ceiling stayed at a constant temperature of 22°C throughout the entire simulation.
This is obviously not what would happen in real life, with an entire raging fire burning under it, so why does it read 22°C?
The ceiling obstruction in this model had the default INERT surface applied to it.
If you remember back to the Your First Fire tutorial, we described the INERT surface.
The `INERT` surface is a surface with a fixed temperature equal to the ambient temperature in the model.Because our model’s ambient temperature is a constant 22°C, the surface and the device recording it are as well.
Try changing the ceiling surface to the ADIABATIC surface and running the model again to see the difference in the results.
Viewing Smoke Detector Activation Time
Select the Smoke Detector in the Time History Plots dialog to view its output over time.
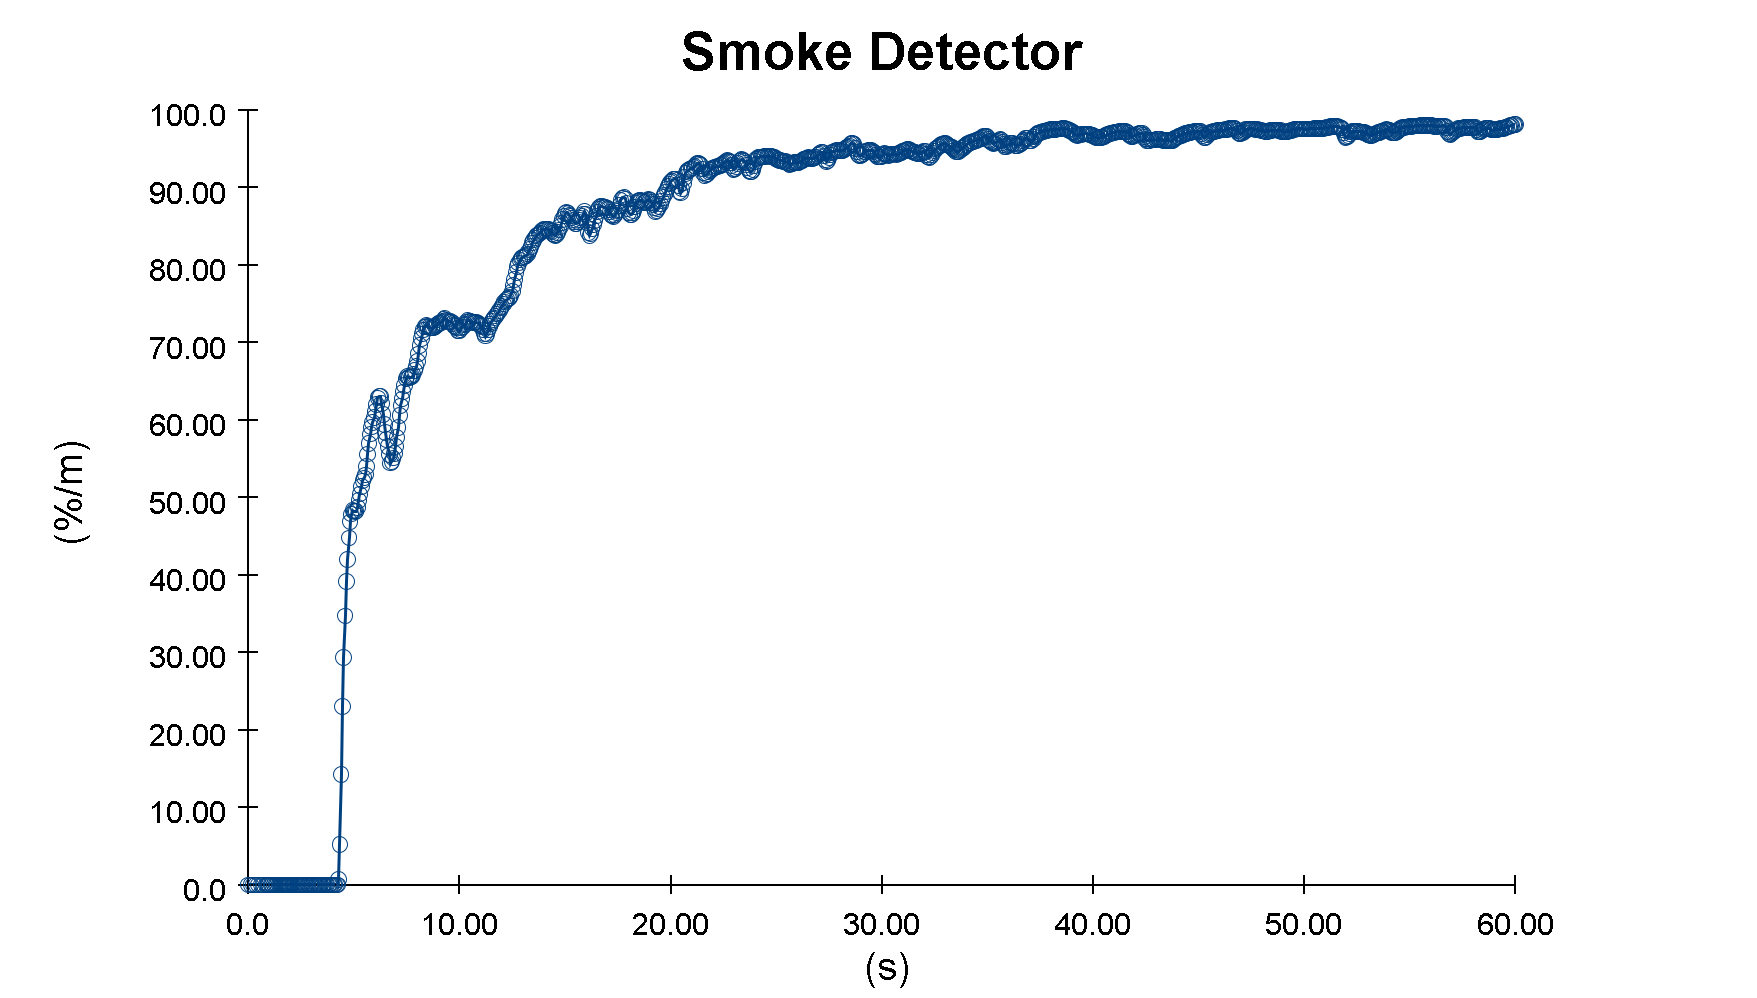
Figure 10 shows the plot of the Smoke Detector’s Obscuration over time.
This value is in units of %/m, which is an industry standard.
By default, smoke detectors will activate at a value of 3.24%/m obscuration.
Based on the plot, we would expect the smoke detector to activate around the 4s mark.
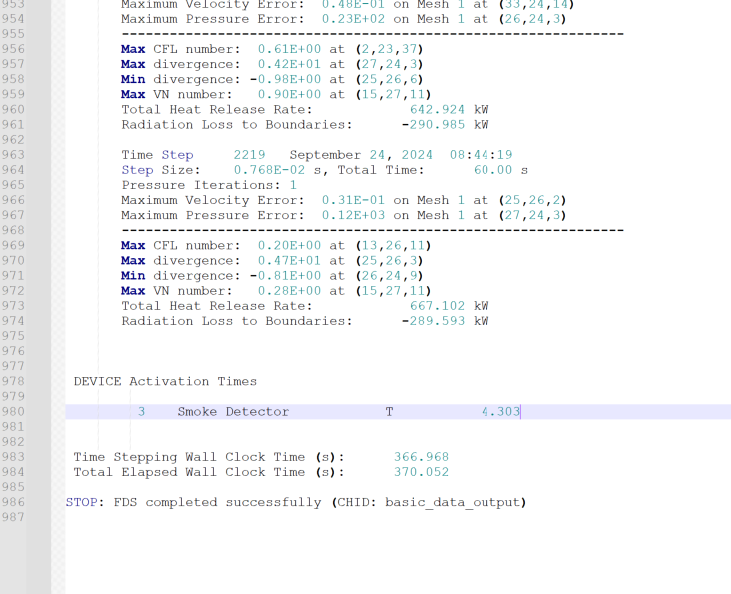
To view the exact activation time of our smoke detector, or any device with a Setpoint (covered in later tutorials), you will need to open the model_name.out file, created by FDS when you run your simulation, in a text editor.
At the bottom of this file, you will find a DEVICE Activation Times section.
In this section, you can see that the Smoke Detector activates at 4.303s.
We can also verify this in the PyroSim Results Viewer. Top open the Results Viewer:
- Click the
 View Results button.
With the Results viewer open, look through the doorway of the room to find the smoke detector.
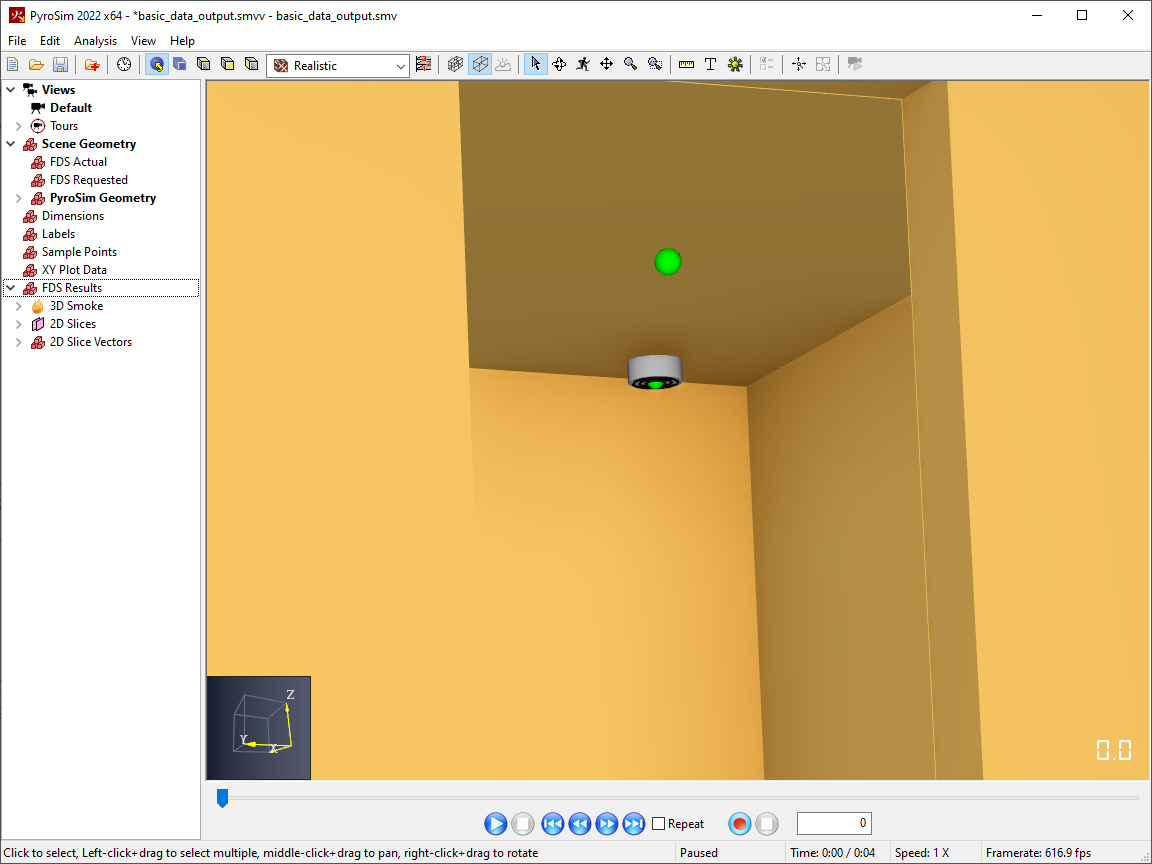
Figure 12 shows the 3D representation of the smoke detector in Results Viewer.
The green light on the detector indicates that it has not yet activated.
Press the ![]() Play button to advance time until
Play button to advance time until 4.2s, and notice that the detector’s light changes color to red.
This indicates that the detector is activated, like we expected it to be.
4.2s.Viewing 2D Slice Data
Doorway Temperature Slice
2D Slice data is also viewed in the Results Viewer. To view the slice, we set up for the doorway temperature:
- In the Results Viewer Navigation View, expand the 2D Slices section.
- Under 2D Slices expand Temperature.
- Double click the
X = 0.080entry to show the doorway temperature slice.
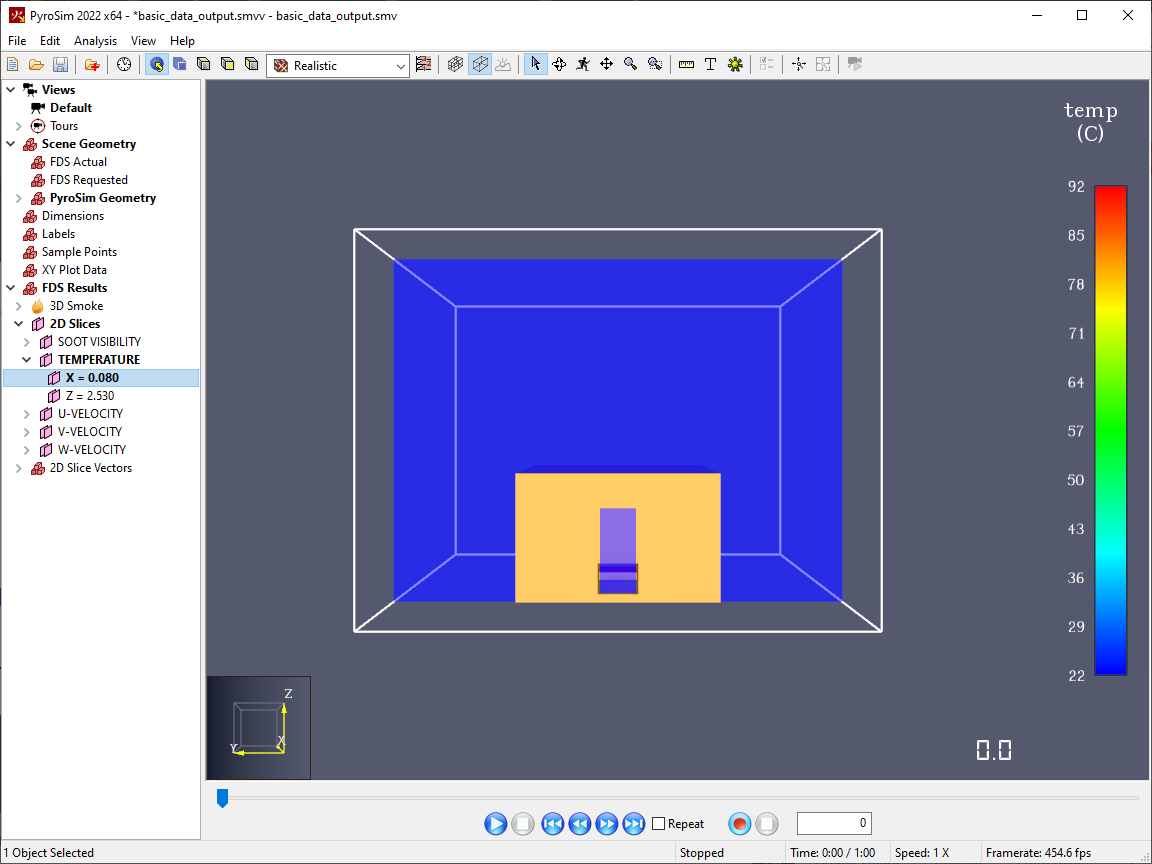
You should now see the 2D Slice plane, with a colorbar on the right side of the screen.
However, if you compare the colorbar to the Doorway Temperature device result plot in Figure 8, the range of the colorbar is quite different.
This is because the colorbar uses the default Percentile (rounded) setting, found in the Results User Manual.
To change this:
- Use the Analysis > FDS Preferences action to open the FDS Preferences dialog.
- Change the Data Range from
Percentile (rounded)toGlobal.
The colorbar should now be a similar range to that in Figure 8. You can click on the colorbar to highlight a specific value. To do this:
- Left-click on the colorbar to set the highlight value to
200°C.
- Press the
 Play button to view the slice results over time.
As you can see in Figure 15, the 200°C value is highlighted black in the playback results.
Ceiling Temperature Slice
Viewing the other slices is mostly the same as Doorway Temperature Slice, however the useful information in those slices is hidden by the geometry of our model. To view the results of the Ceiling Temperature Slice:
- Hide the model geometry by double-clicking on PyroSim Geometry.
- Enable the
Z = 2.530Temperature Slice
You should now see both the doorway temperature and the ceiling temperature slices in the 3D window.
Because you selected Yes in the Use Vector? column for the ceiling temperature slice, there is also an additional 2D Slice Vectors object created for the slice.
These can be overlaid on top of the existing 2D slices; however, it might be clearer to show them separately.
To show these vectors:
- Hide the enabled Temperature slices.
- Under 2D Slices > Temperature, double-click the
Z=2.530object.
You should now see the vector plot for Temperature. Because Temperature is a scalar quantity, the length and direction of the vector show the direction and relative speed of the flow of the fluid in that cell. The color of the vector shows the value of the quantity, shown in the color bar. (McGrattan et al. 2021, 294-295)
Visibility Slice Results
Showing the visibility slice results is much the same as the ceiling temperature slice in Ceiling Temperature Slice.
The only thing to note here is that because you selected Yes in the Cell Centered? column when defining the slice, the results will look blocky.
This is because by default, slices are interpolated at cell corners in order to smooth out the results plot.
Defining slices as cell-centered disables this interpolation, so the values will change sharply from cell to cell.
To show the visibility slice:
- Double-click the
Z = 1.795 [cell centered]object under 2D Slices > SOOT VISIBILITY. - Right-click the colorbar to disable the highlighting set up for the previous slices.
Conclusion
That’s it! You should now be familiar with how to create additional basic data outputs for your simulations, as well as how to view those outputs in the Results viewer. There are many other types of data outputs available in PyroSim and FDS, however those will be covered in more advanced tutorials.
You can download the complete model files for this tutorial here: Basic Data Output
To continue building your skillset, check out the related tutorials linked below.
Please contact support@thunderheadeng.com with any questions or feedback regarding our products or documentation.
Bibliography
McGrattan, Kevin, Simo Hostikka, Randall McDermott, Jason Floyd, and Marcos Vanella. 2021. Fire Dynamics Simulator User’s Guide, NIST Special Publication 1019. Sixth Edition. National Institute of Standards and Technology, Gaithersburg, Maryland, USA: NIST.
Related Tutorials
This tutorial will walk you through adding some basic fire protection systems to your PyroSim model.
This tutorial will walk you through adding and layering materials, allowing for more complex heat transfer in your PyroSim model.
Tutorial demonstrating how to verify HVAC Pressure Drop in Pyrosim.