Introduction
This post demonstrates how to use Pathfinder to simulate movement in a subway station, with trains arriving and departing from the station. A growing list of features not specific to evacuation make Pathfinder applicable to a broad range of pedestrian movement problems.
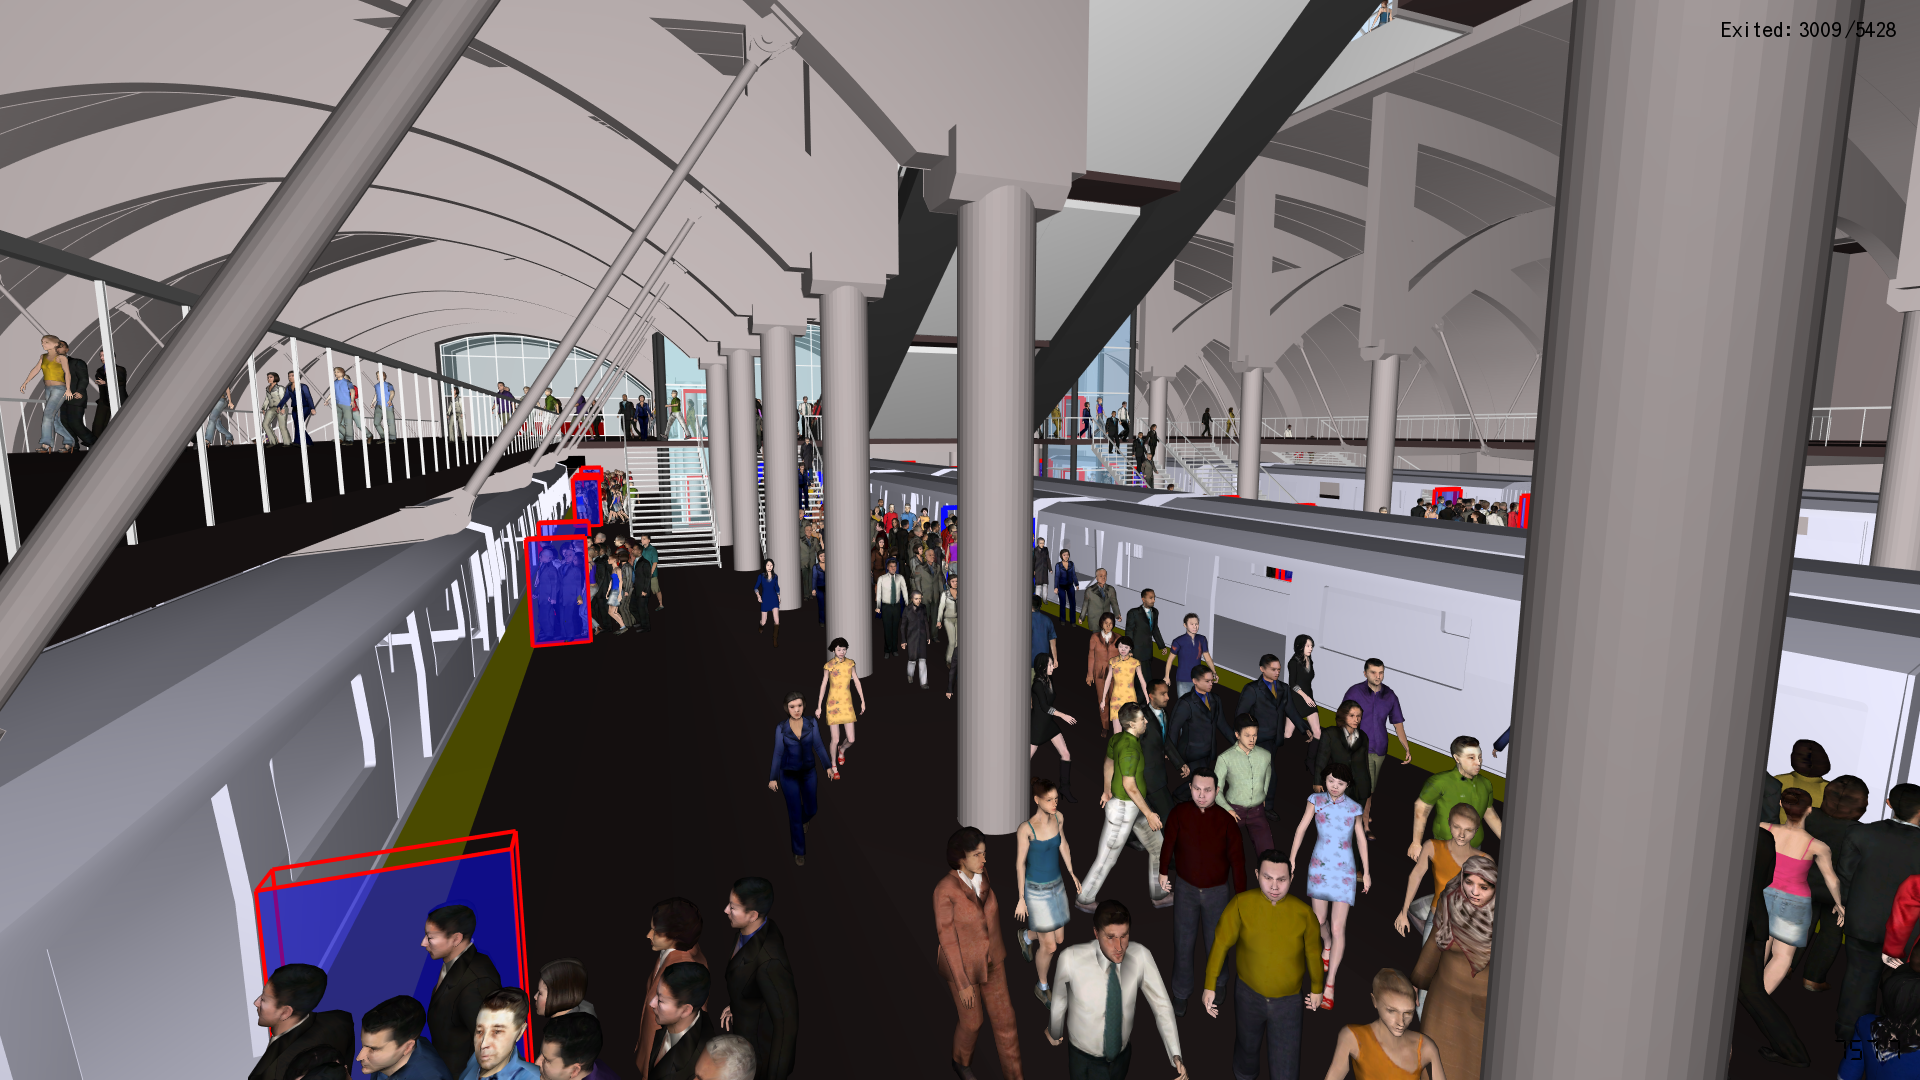
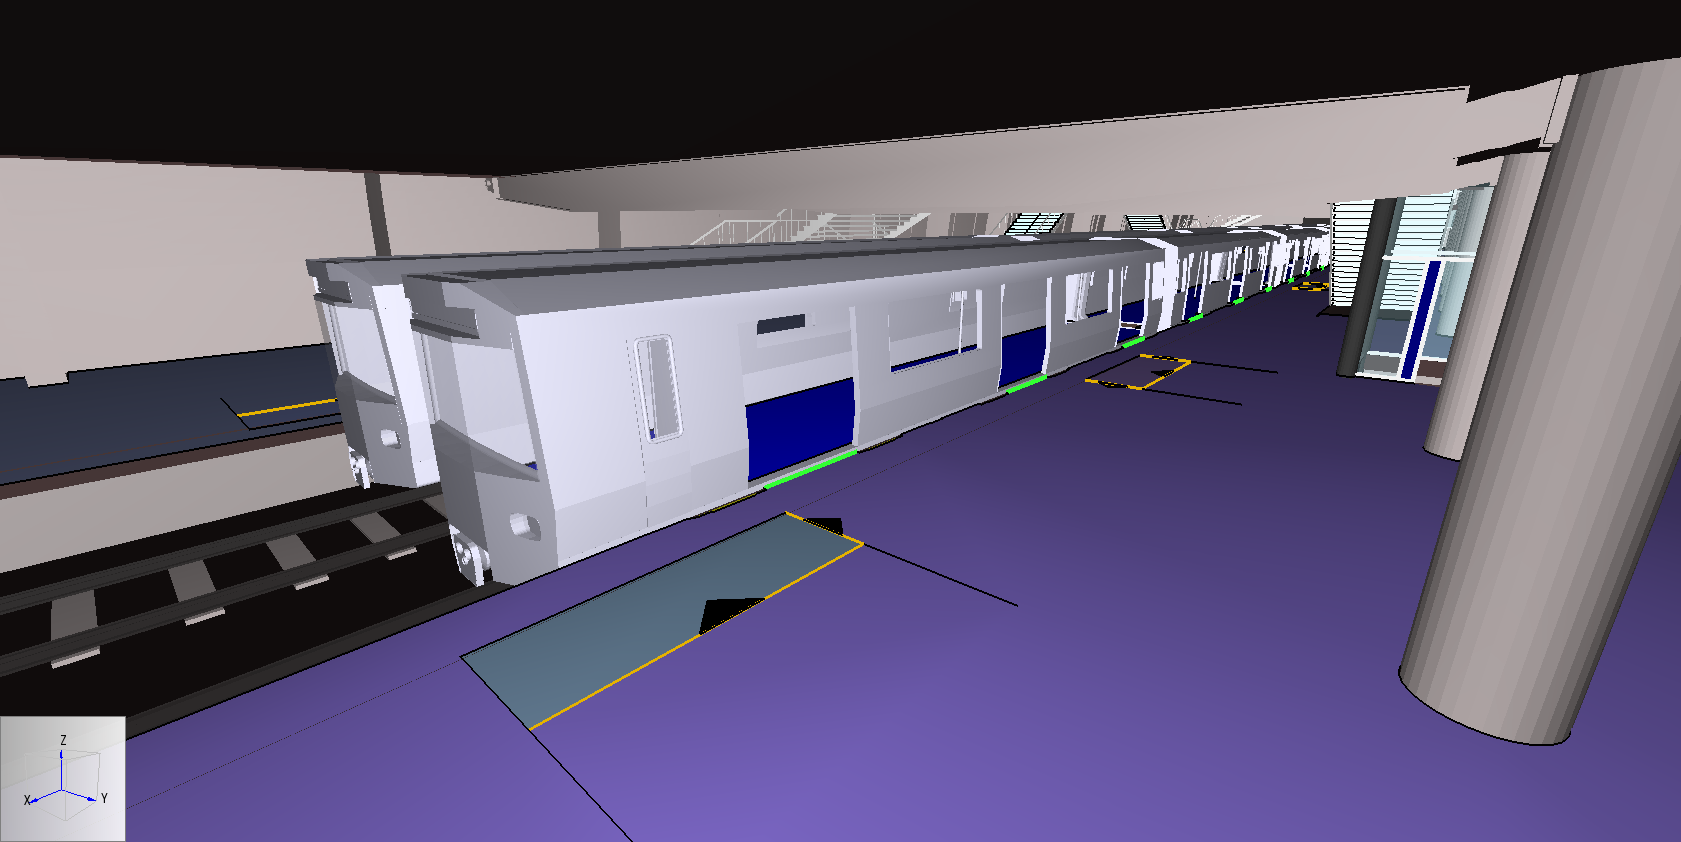
The subway station is illustrated in Figure 1, which shows passengers on the upper platform.
Our model will simulate the continuous entry of passengers into the station to board specific trains and the exit of passengers from trains that have arrived at the station.
The model includes 10 trains: 6 on the upper platform and 4 on the lower platform.
We assume that each train arrives and departs at a 10-minute interval.
The arrival times are staggered, so that one train arrives each minute.
Each train unloads and then loads 200 passengers, giving a total flow exiting the station of 200 persons/minute or 12000 persons/hour (the same number also arrive at the station).
The train loading was chosen to be consistent both with the size and number of cars in each train and with the flow capacity of the stairs and escalators.
Brandon Lambrecht, now an architect at Mahlum Architects in Portland, created the subway CAD model while a summer intern at Thunderhead Engineering. It does not represent a real-world location. The CAD model was drawn in Revit and imported into Pathfinder using the FBX import feature. The extract floor tool was used to incorporate the imported geometry into the Pathfinder model. To learn more about importing CAD geometry, see the Importing CAD files section of the Pathfinder User Manual or visit the Fundamentals tutorial. There are also resources available that provide examples of the process, entitled Import DWG File Into Pathfinder and Create a model from imported dwg files.
Before Starting
- Download the Subway Circulation zip file.
Conceptual Model
Before describing the subway model, it is useful to demonstrate the approach using a small conceptual model. Figure 2 shows a simple conceptual train schedule.
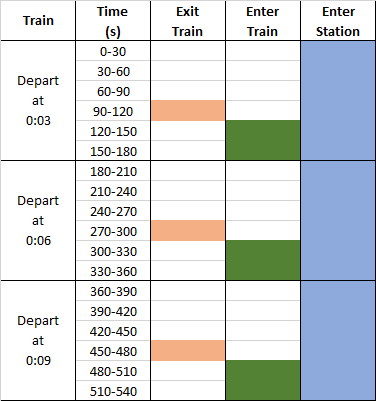
A train departs at 3-minute intervals, with 30 seconds of unloading and 60 seconds of loading.
Passengers enter the station continuously at a rate of 12 pers/min and exit the train at a flow rate of 1.2 pers/s for 30 seconds.
While a continuous flow of passengers enter the station and queue, subway trains arrive and depart with on the set schedule in Figure 2. The subway train first discharges passengers for 30 seconds, and then waits for 60 seconds as passengers board the train.
There are two main approaches to model waiting in Pathfinder: the Waiting Room Method and the Queues Method
Waiting Room Method
Passengers who board the train have a behavior that tells them to go to the wait room and then proceed to the subway door. Figure 3 shows the geometry of a simple station. The door on the right is the station door, with an attached source that inserts new passengers into the model and provides an exit for passengers who leave the station. The wait room with its doors and split line are one method of managing queues.

As shown in Figure 3, the wait room has a one-way entry door, a one-way exit door, and a split line that extends the entry space.
The details of the wait room work together to accomplish this movement.
- First, the wait room is small so that queuing passengers will try to move as close as possible to the room. This has the effect of moving passengers to the front of the queue.
- The split line is a barrier that guides the passengers to form a queue, rather than form a semicircle around the wait room.
- The one-way wait room entry doorway ensures that passengers will only leave the wait room using the wait room exit.
- Finally, the wait room exit door can be opened and closed; when closed, a queue forms. When open, the passengers leave the wait room and board the train.
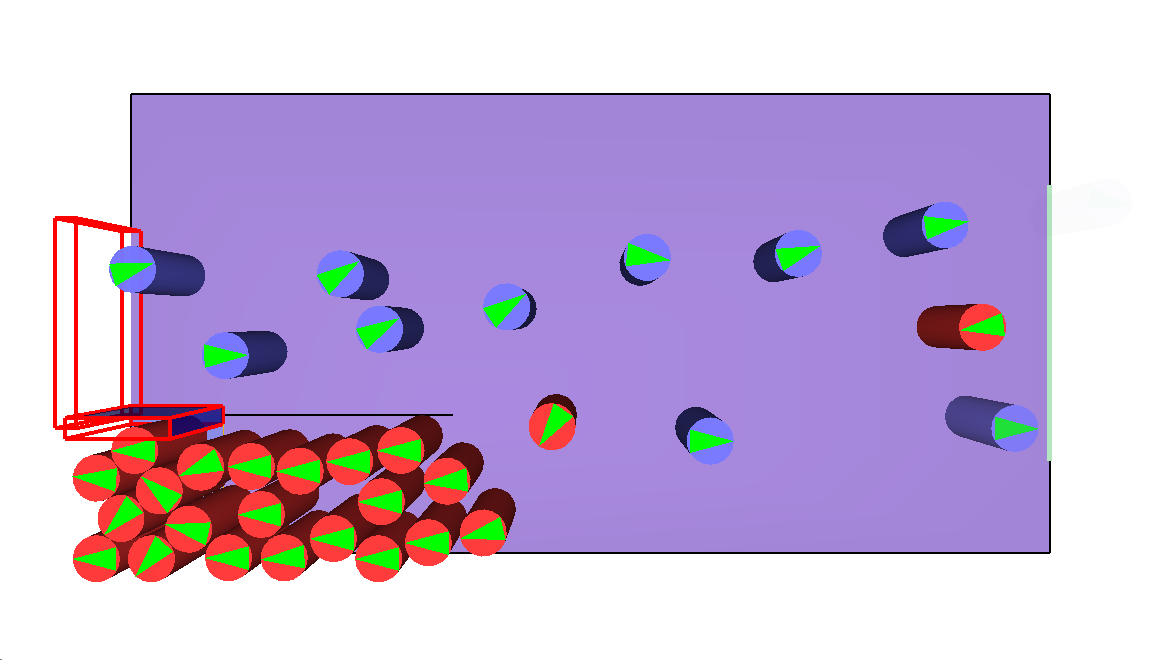
Figure 4 shows how waiting passengers queue at the wait room while passengers exit the subway train.
The video below demonstrates this movement dynamically. Run your own version of the model with the station-conceptual-model.pth file from the zip folder. We will use the same conceptual approach to make the more complex subway model.
Queues Method
For Pathfinder releases since 2021.2, there is another tool to model waiting, called Queues.
Visit the Simple Queues how-to and the Subway Circulation and Emergency Evacuation application to understand this alternative approach. The following Subway Model uses waiting rooms.
Subway Model
Subway Navigation Mesh
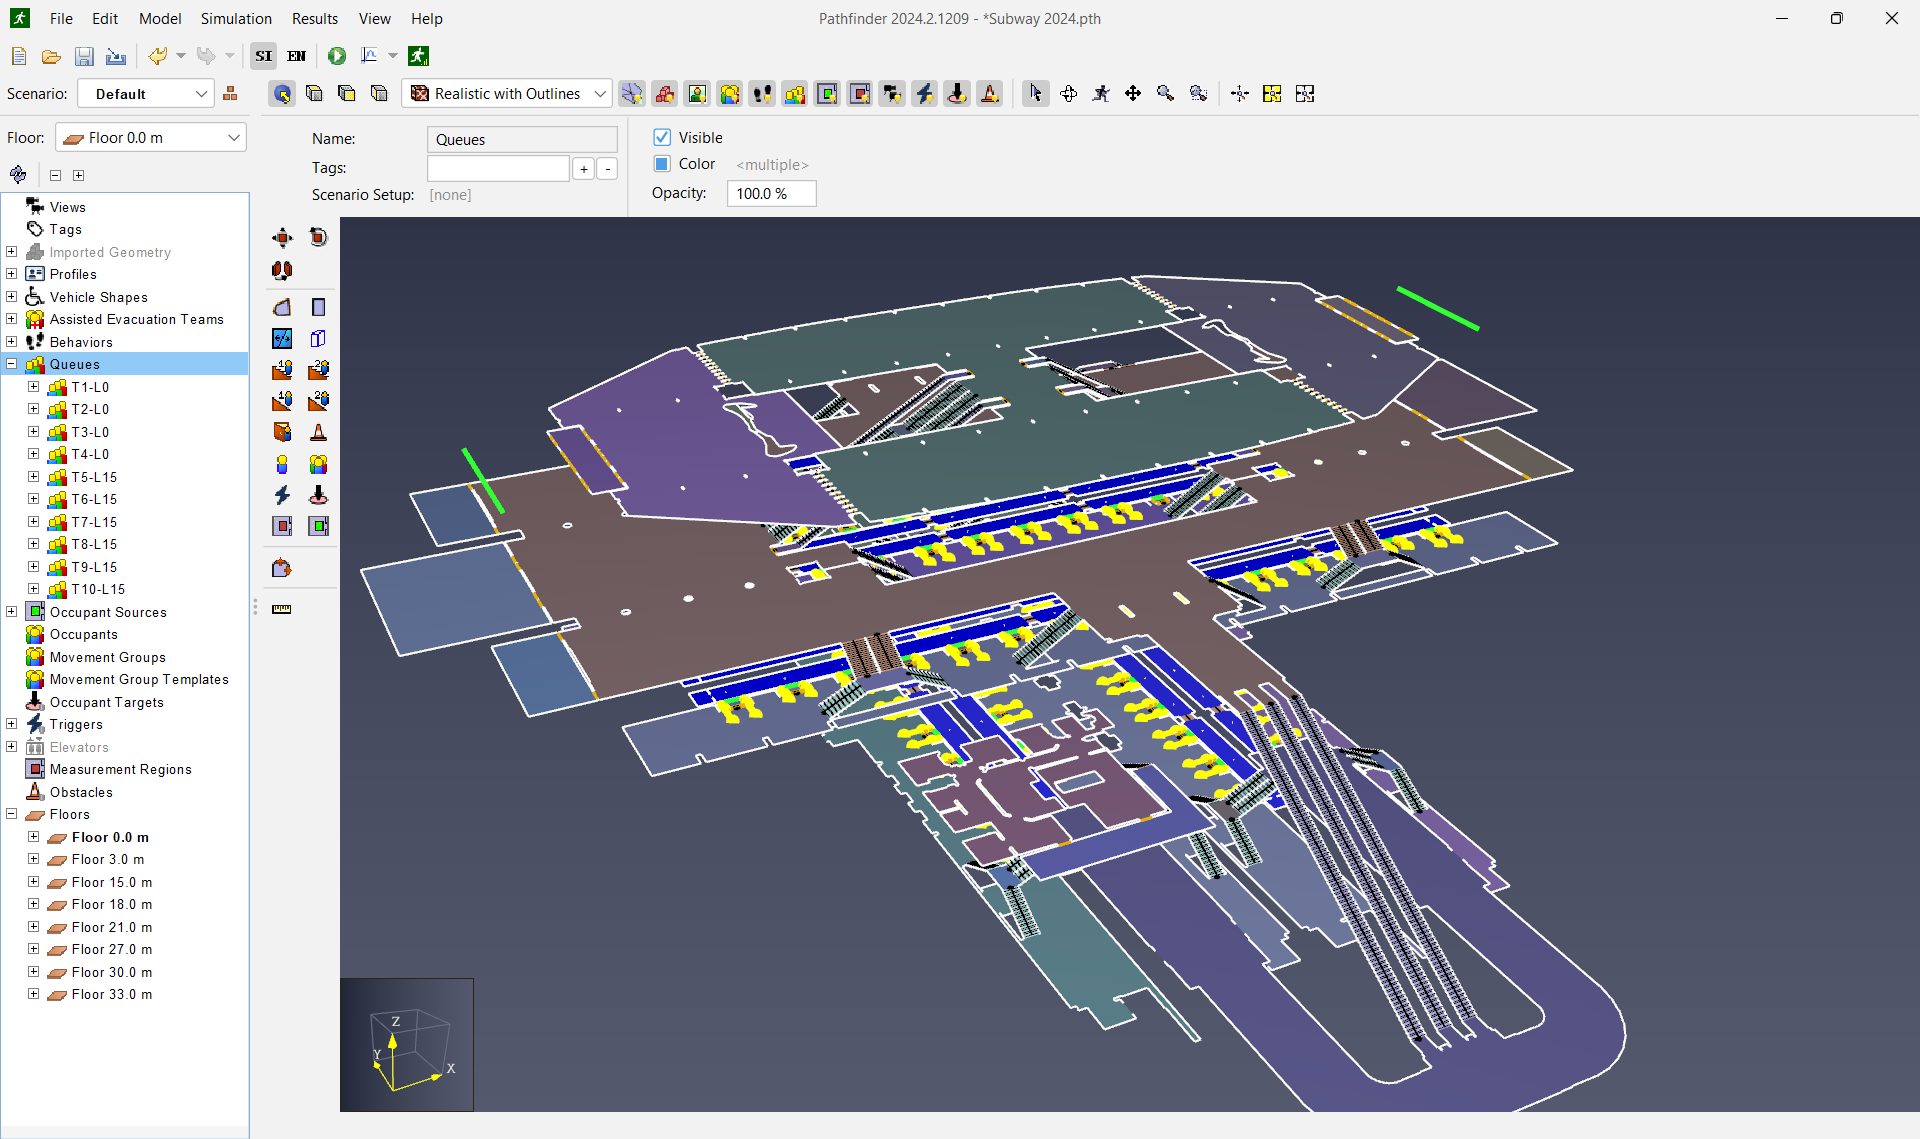
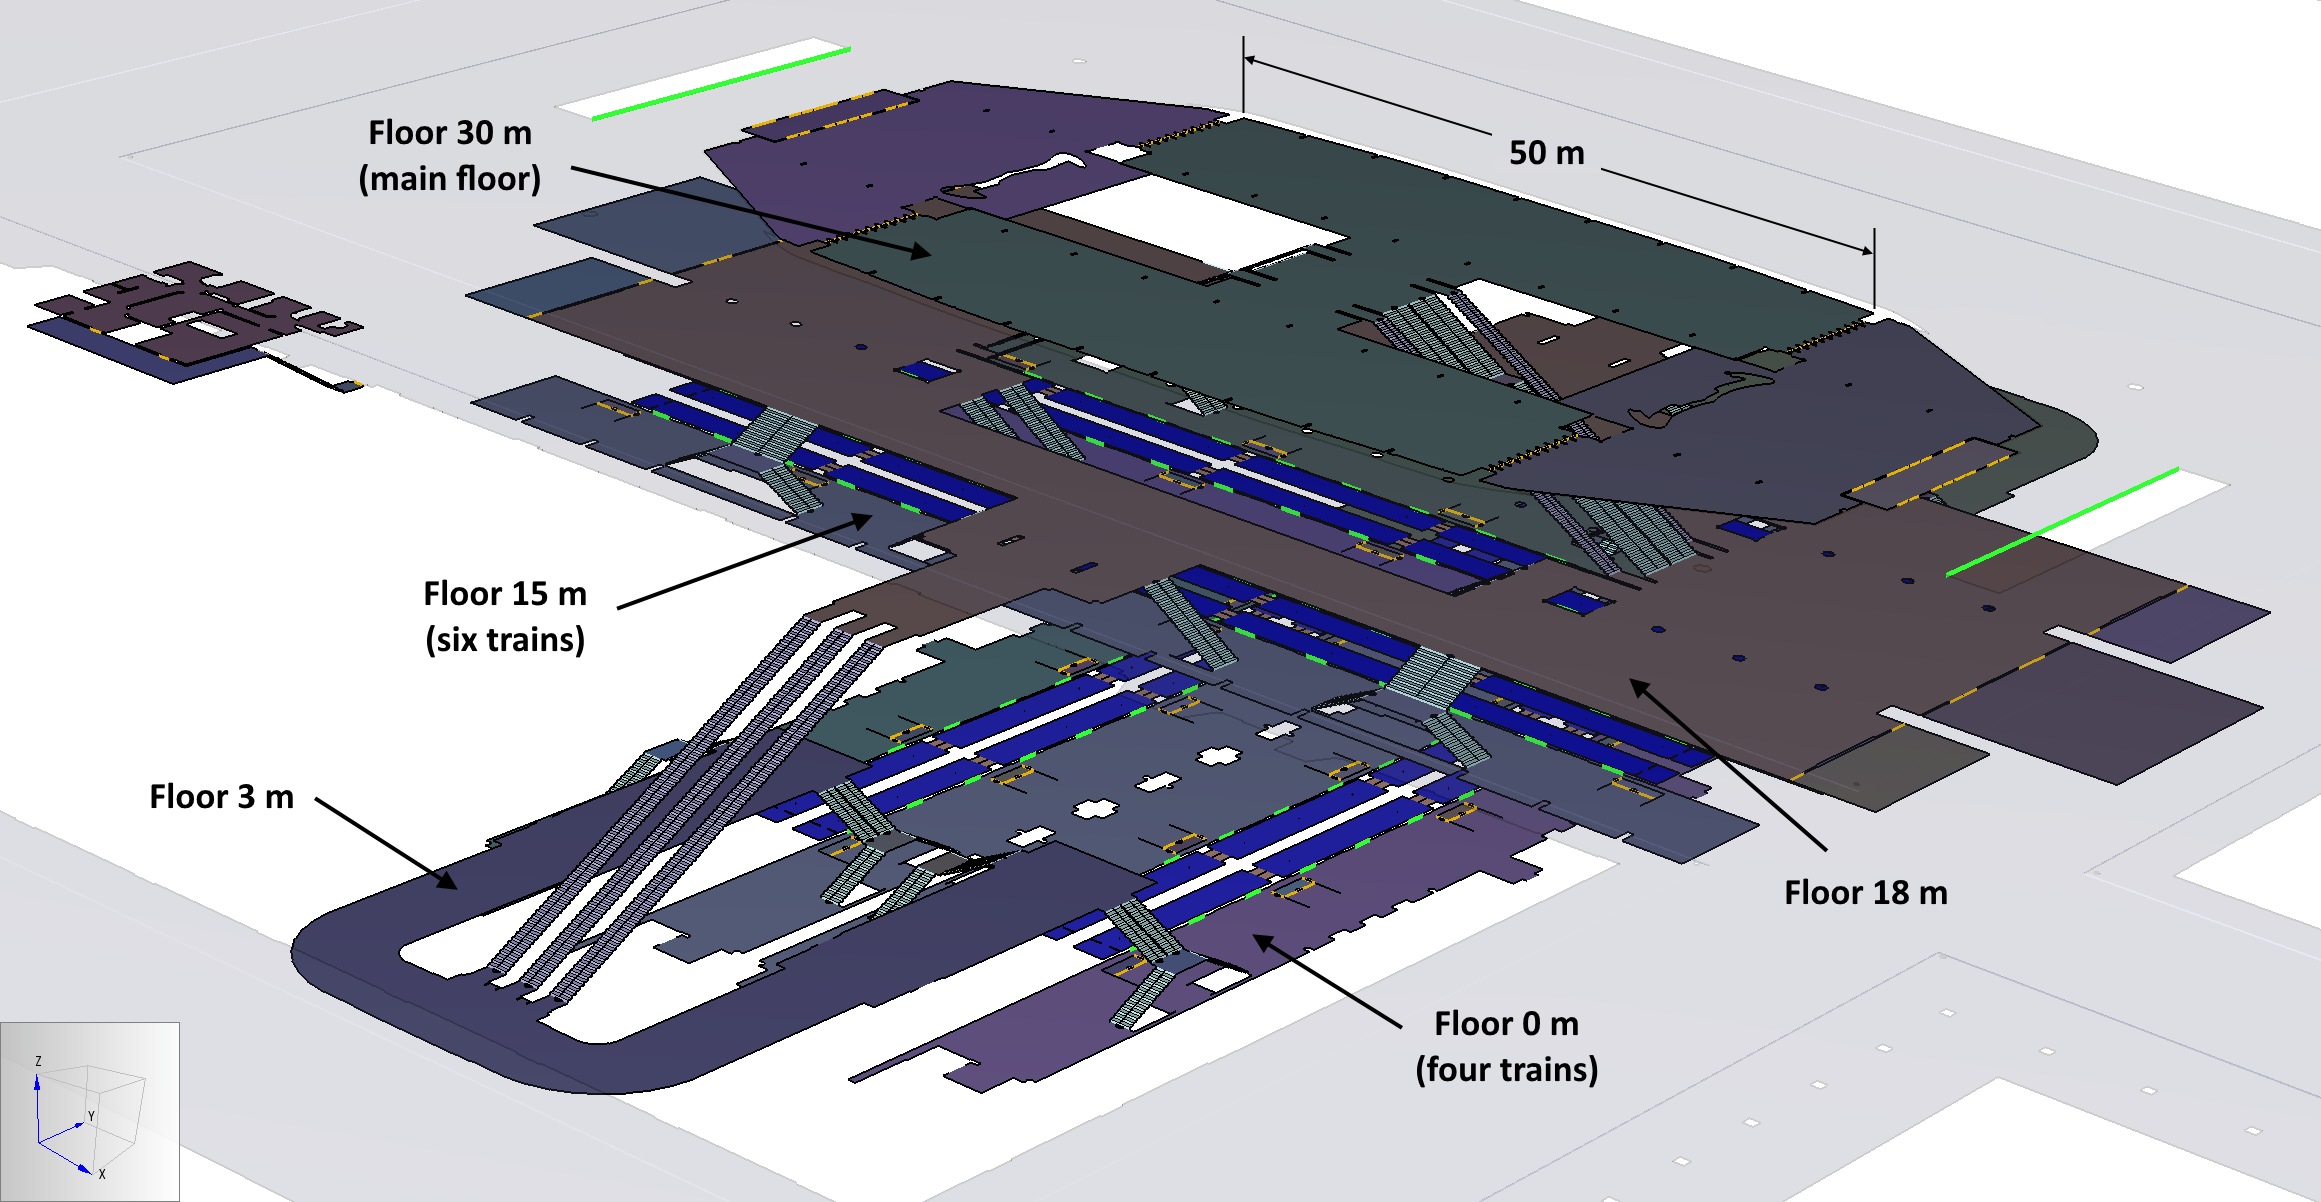
The subway model is shown in Figure 6 and has five main floors:
- Floor 0.0 m - This is the lower platform floor. Four trains connect to this floor. Stairs connect Floor 0 m to Floor 3 m.
- Floor 3.0 m - One side of this floor gathers the passengers exiting from Floor 0 m and delivers them by escalator to Floor 18 m. The other side of Floor 3 m is used by passengers descending from Floor 18 m to Floor 0 m to board trains.
- Floor 15.0 m - This is the upper platform floor. Six trains connect to this floor. Stairs connect Floor 15 m to Floor 18 m. The stairs on one side of Floor 15 m are used for passengers ascending to exit the station and the other side is for passengers descending to board trains.
- Floor 18.0 m - This floor gathers and distributes all flow from and to Floor 3 m and Floor 15 m. Both stairs and escalators connect Floor 18 m to Floor 30 m. One set of stairs and escalators brings flow up to Floor 30 m and one set brings flow down from Floor 30 m.
- Floor 30.0 m - This is the main floor level. All passengers enter and leave the station from this level. One side of this floor is for passengers who proceed to trains and the other side is for passengers who arrived by train and are leaving the station.
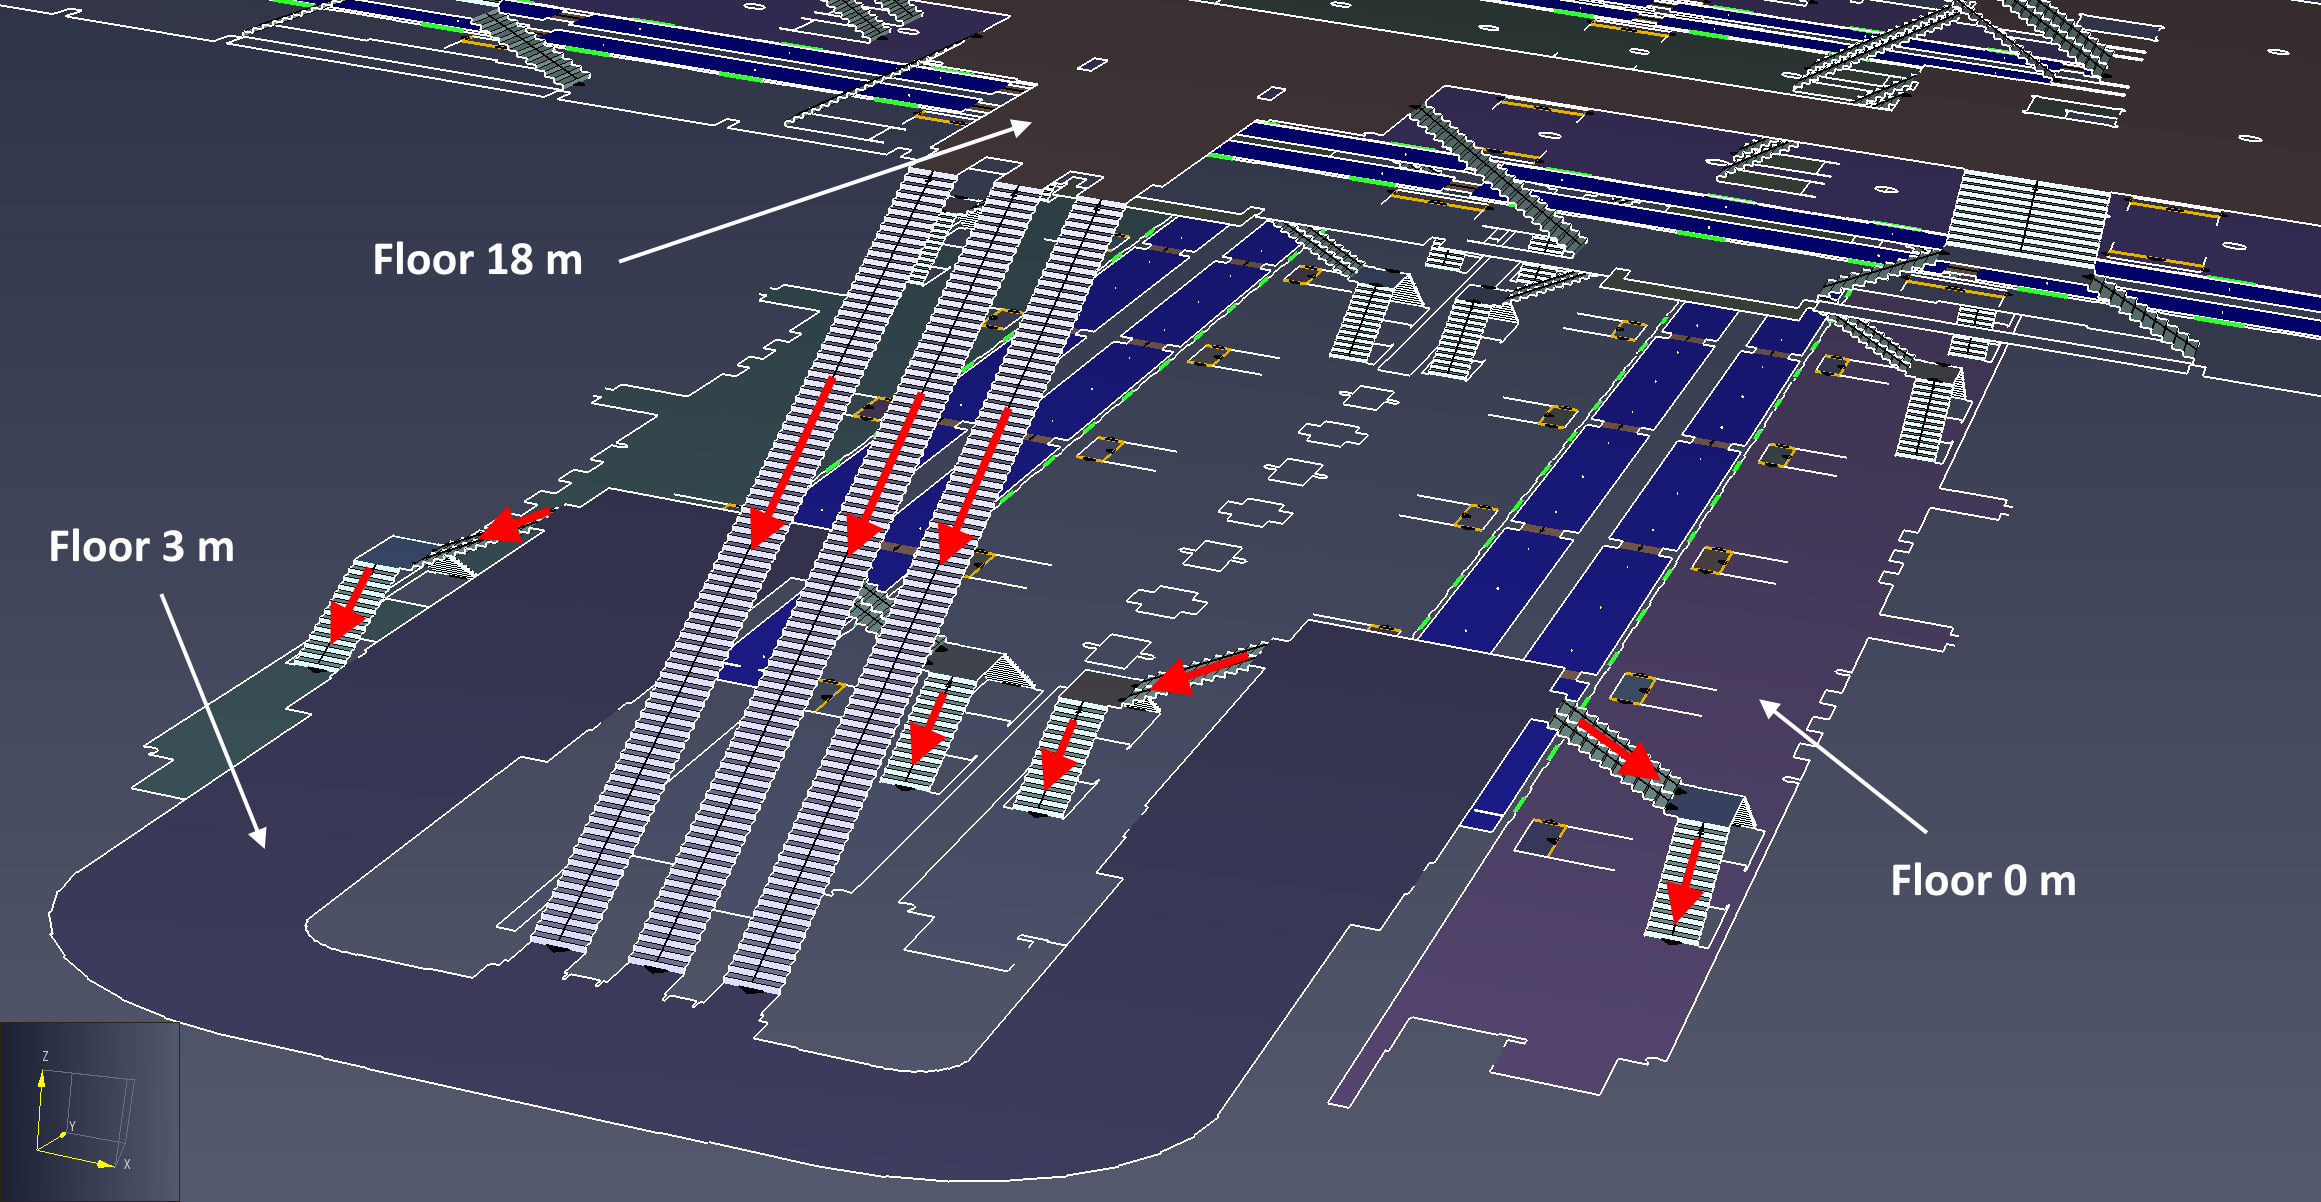
The stairs and escalators are specified either for flow up or flow down. Figure 7 shows a detail of the flow descending from Floor 18 m, through Floor 3 m, and then down to the lower platform, Floor 0 m. The red arrows show the direction of flow. At the other end of Floor 3 m, the flow is up to Floor 18 m. Floor 18 m connects to the main floor by stairs and escalators.
As illustrated in the Conceptual Model, wait rooms with entry and exit doors are used to control the flow of passengers entering trains. Figure 8 shows a combined CAD (imported geometry) and navigation mesh view of the end car of Train #6, located on the upper platform (Floor 15.0 m). You can see the wait rooms, the one-way doors to enter and leave the wait rooms, and the exit/entrance doors of the train. The corresponding navigation mesh with details is shown in Figure 9.

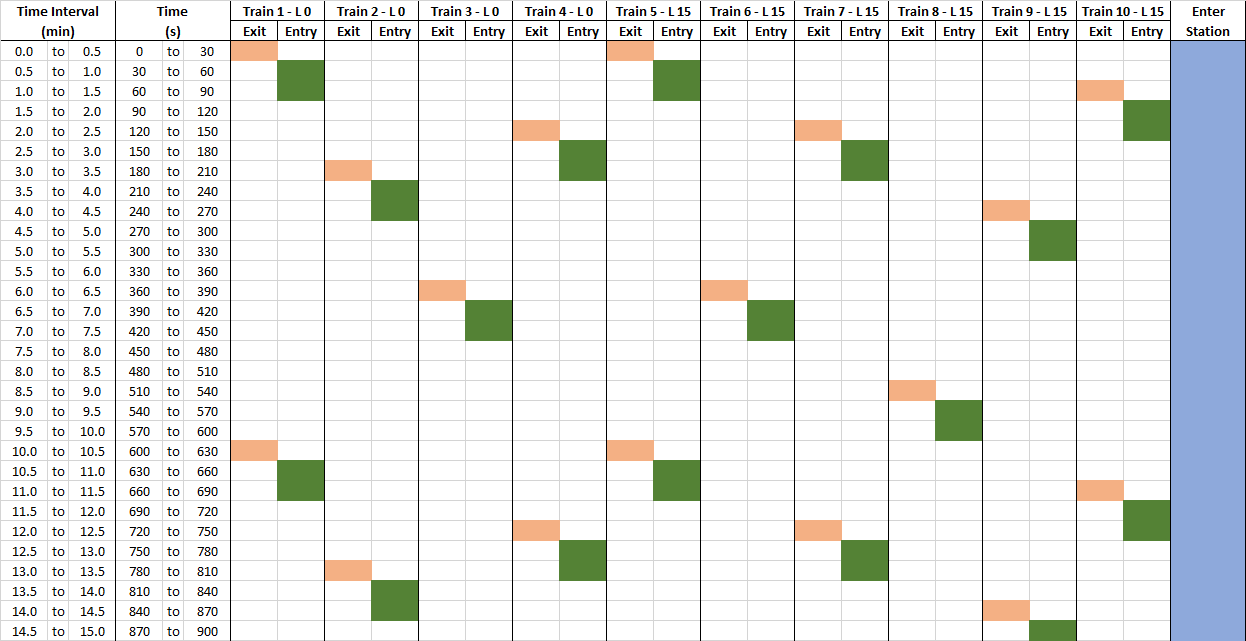
The subway schedule for the first 15 minutes is shown in Figure 10. Each train arrives every 10 minutes and delivers 200 passengers. The passengers exit the train in 30 seconds Then queued passengers board the train for 60s. To be clear, Pathfinder does not animate the train arrival and departure; the arrival and departure is simulated by opening and closing doors for the train and wait rooms.
Subway Schedule
Occupant Settings
The behavior of passengers is determined by their profiles (physical characteristics) and behaviors (specified movement goals). In addition, sources are used to define the entry flow of passengers into the station and the flow of passengers exiting the trains. The profiles, behaviors, and sources used in the model are listed in Figure 11.
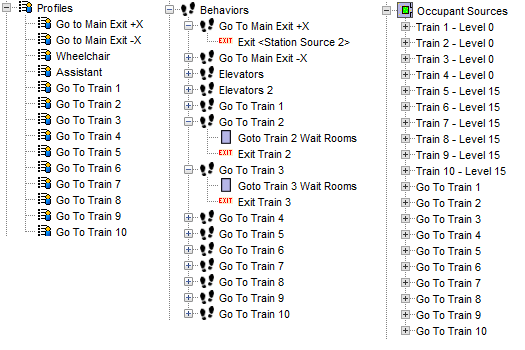
The Profiles shown in Figure 11 assign movement speed and other physical characteristics.
All passengers have movement speed set within an associated profile. Movement speed could be assigned with a statistical uniform distribution, as detailed in a later tutorial section, Uniformly Distributed Speeds.
Alternately, the Pathfinder framework supports defining detailed profiles for each passenger type, for example, a "child" profile could use the child avatar and have a speed range appropriate for children, while a "young male" profile could use an avatar of a young man and have a different appropriate speed range.
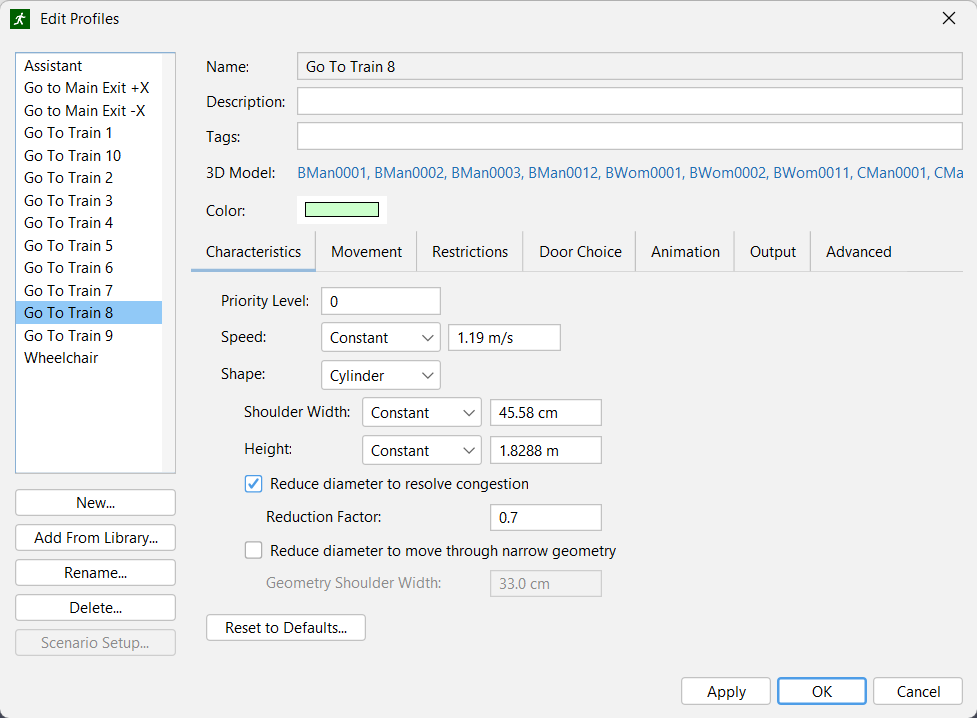
In Subway 10 Final.pth, multiple profiles are used to assign different colors to passengers, depending on the train they are to board or if they are to exit the station. All occupants are assigned a constant movement speed of 1.19 m/s, across all profiles.
The Behaviors shown in Figure 11 define how the passengers will move.
Passengers exiting the trains are randomly assigned to go to one of the two station exits. Passengers who are entering the station to board trains are randomly assigned to go to one of the trains, so they first proceed to any of the wait rooms associated with queuing for that train and then board the train when the wait queue exit door opens.
The Occupant Sources shown in Figure 11 determine where Behaviors and Profiles are deployed in the Navigation Mesh.
Each occupant source can be assigned a distribution of different profiles and different behaviors. When an occupant is created by the source, the occupant is randomly assigned a profile and behavior from the distribution.
Occupant sources are associated with the train doors for passengers exiting the trains and with two sources outside the station (the two long green lines in Figure 6) for passengers who enter the station to board trains.
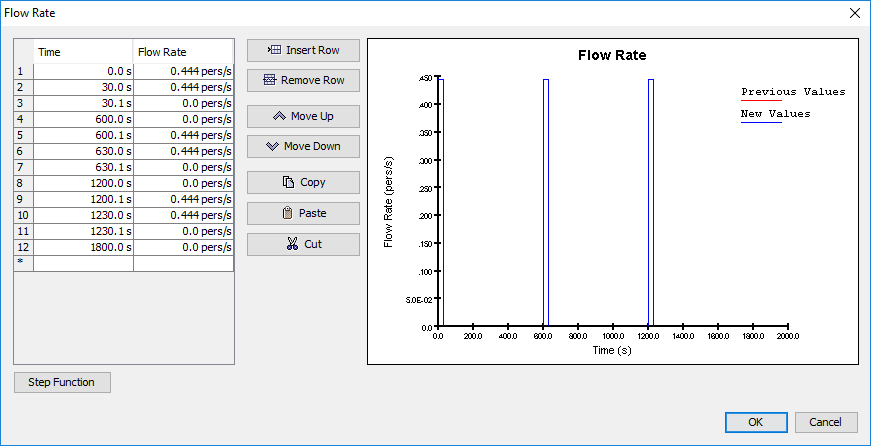
The exit flow from the trains is periodic, as shown in Figure 12.
Each train has 15 doors and the exit interval from the train is 30 seconds, so a flow rate of 0.4444 pers/s gives a total of 200 passengers every 10 minutes.
Since there are 10 trains, this gives the arrival of 200 passengers every minute (or 200 passengers for each train every 10 minutes).
The sources associated with passengers entering the station (the two long green lines on Level 30 m in Figure 6) have a continuous flow of 0.1666 pers/s per train, or 12000 pers/hr, which matches the total flow out of the station from the trains.
Results
An overview of the results is provided by the Subway Simulation Using Pathfinder video tour, found in section Modeling Hints and Video Tour. This shows the movement from 510 s to 660 s after the start of the simulation.
One way to look at the use of space in more detail is to plot accumulated usage contours. Figure 13 shows accumulated usage contours for the main floor. These contours are at 1800 seconds (30 minutes) and the contour range is 0 to 500 seconds.
Remember, complicated contour visualizations can be created in the 3D results program included with Pathfinder. Pathfinder visualizations can be saved as .pfrv files.
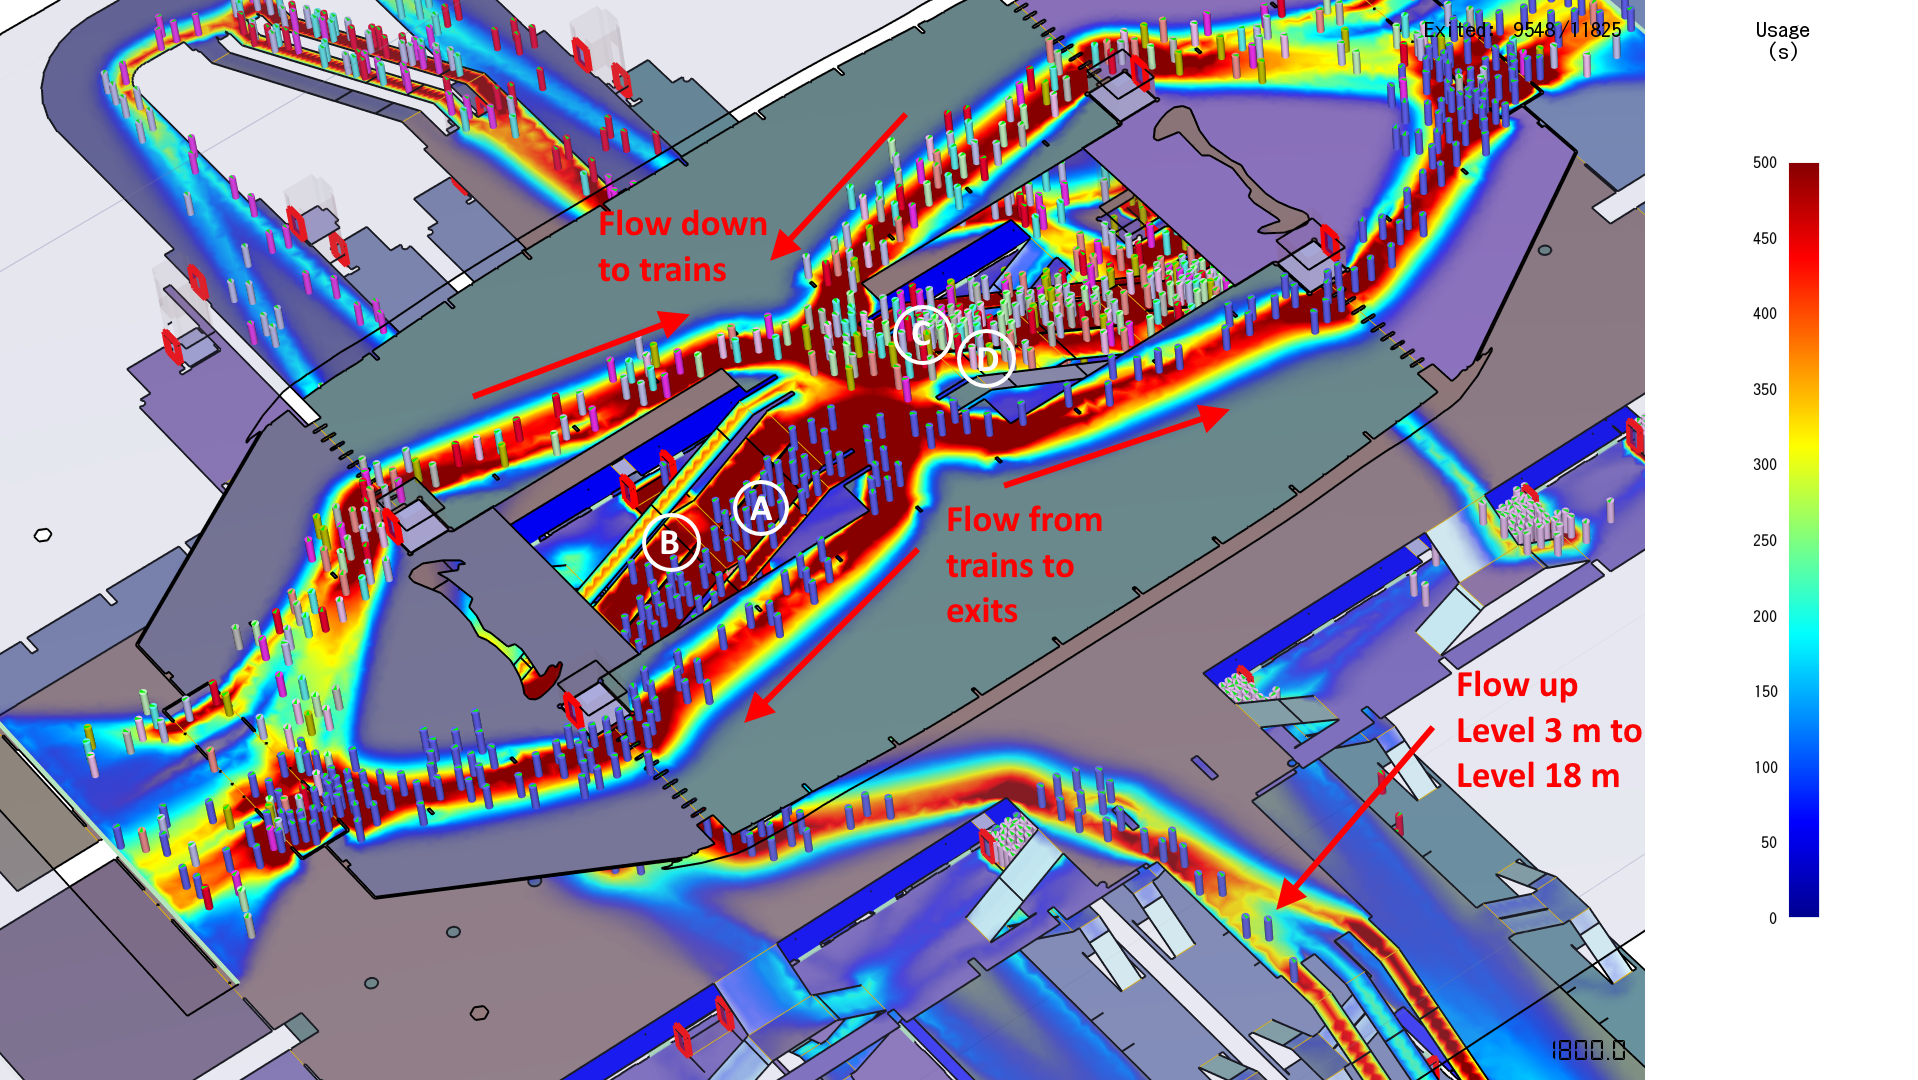
Let us look in more detail at stairs A and B, which manage flow up from the trains, and at stairs C and D, which manage flow downward to board the trains. The contours show that stair A is used more than B. The reason for this is that stair A is closest to the flow up from the trains from Level 3 m, so more passengers use the closer stairway. But because there is also upward flow on both sides from Level 15 m to Level 18, Stair B also sees significant use. All downward flow enters on the side closest to Stair C, so it is much more heavily used than Stair D.
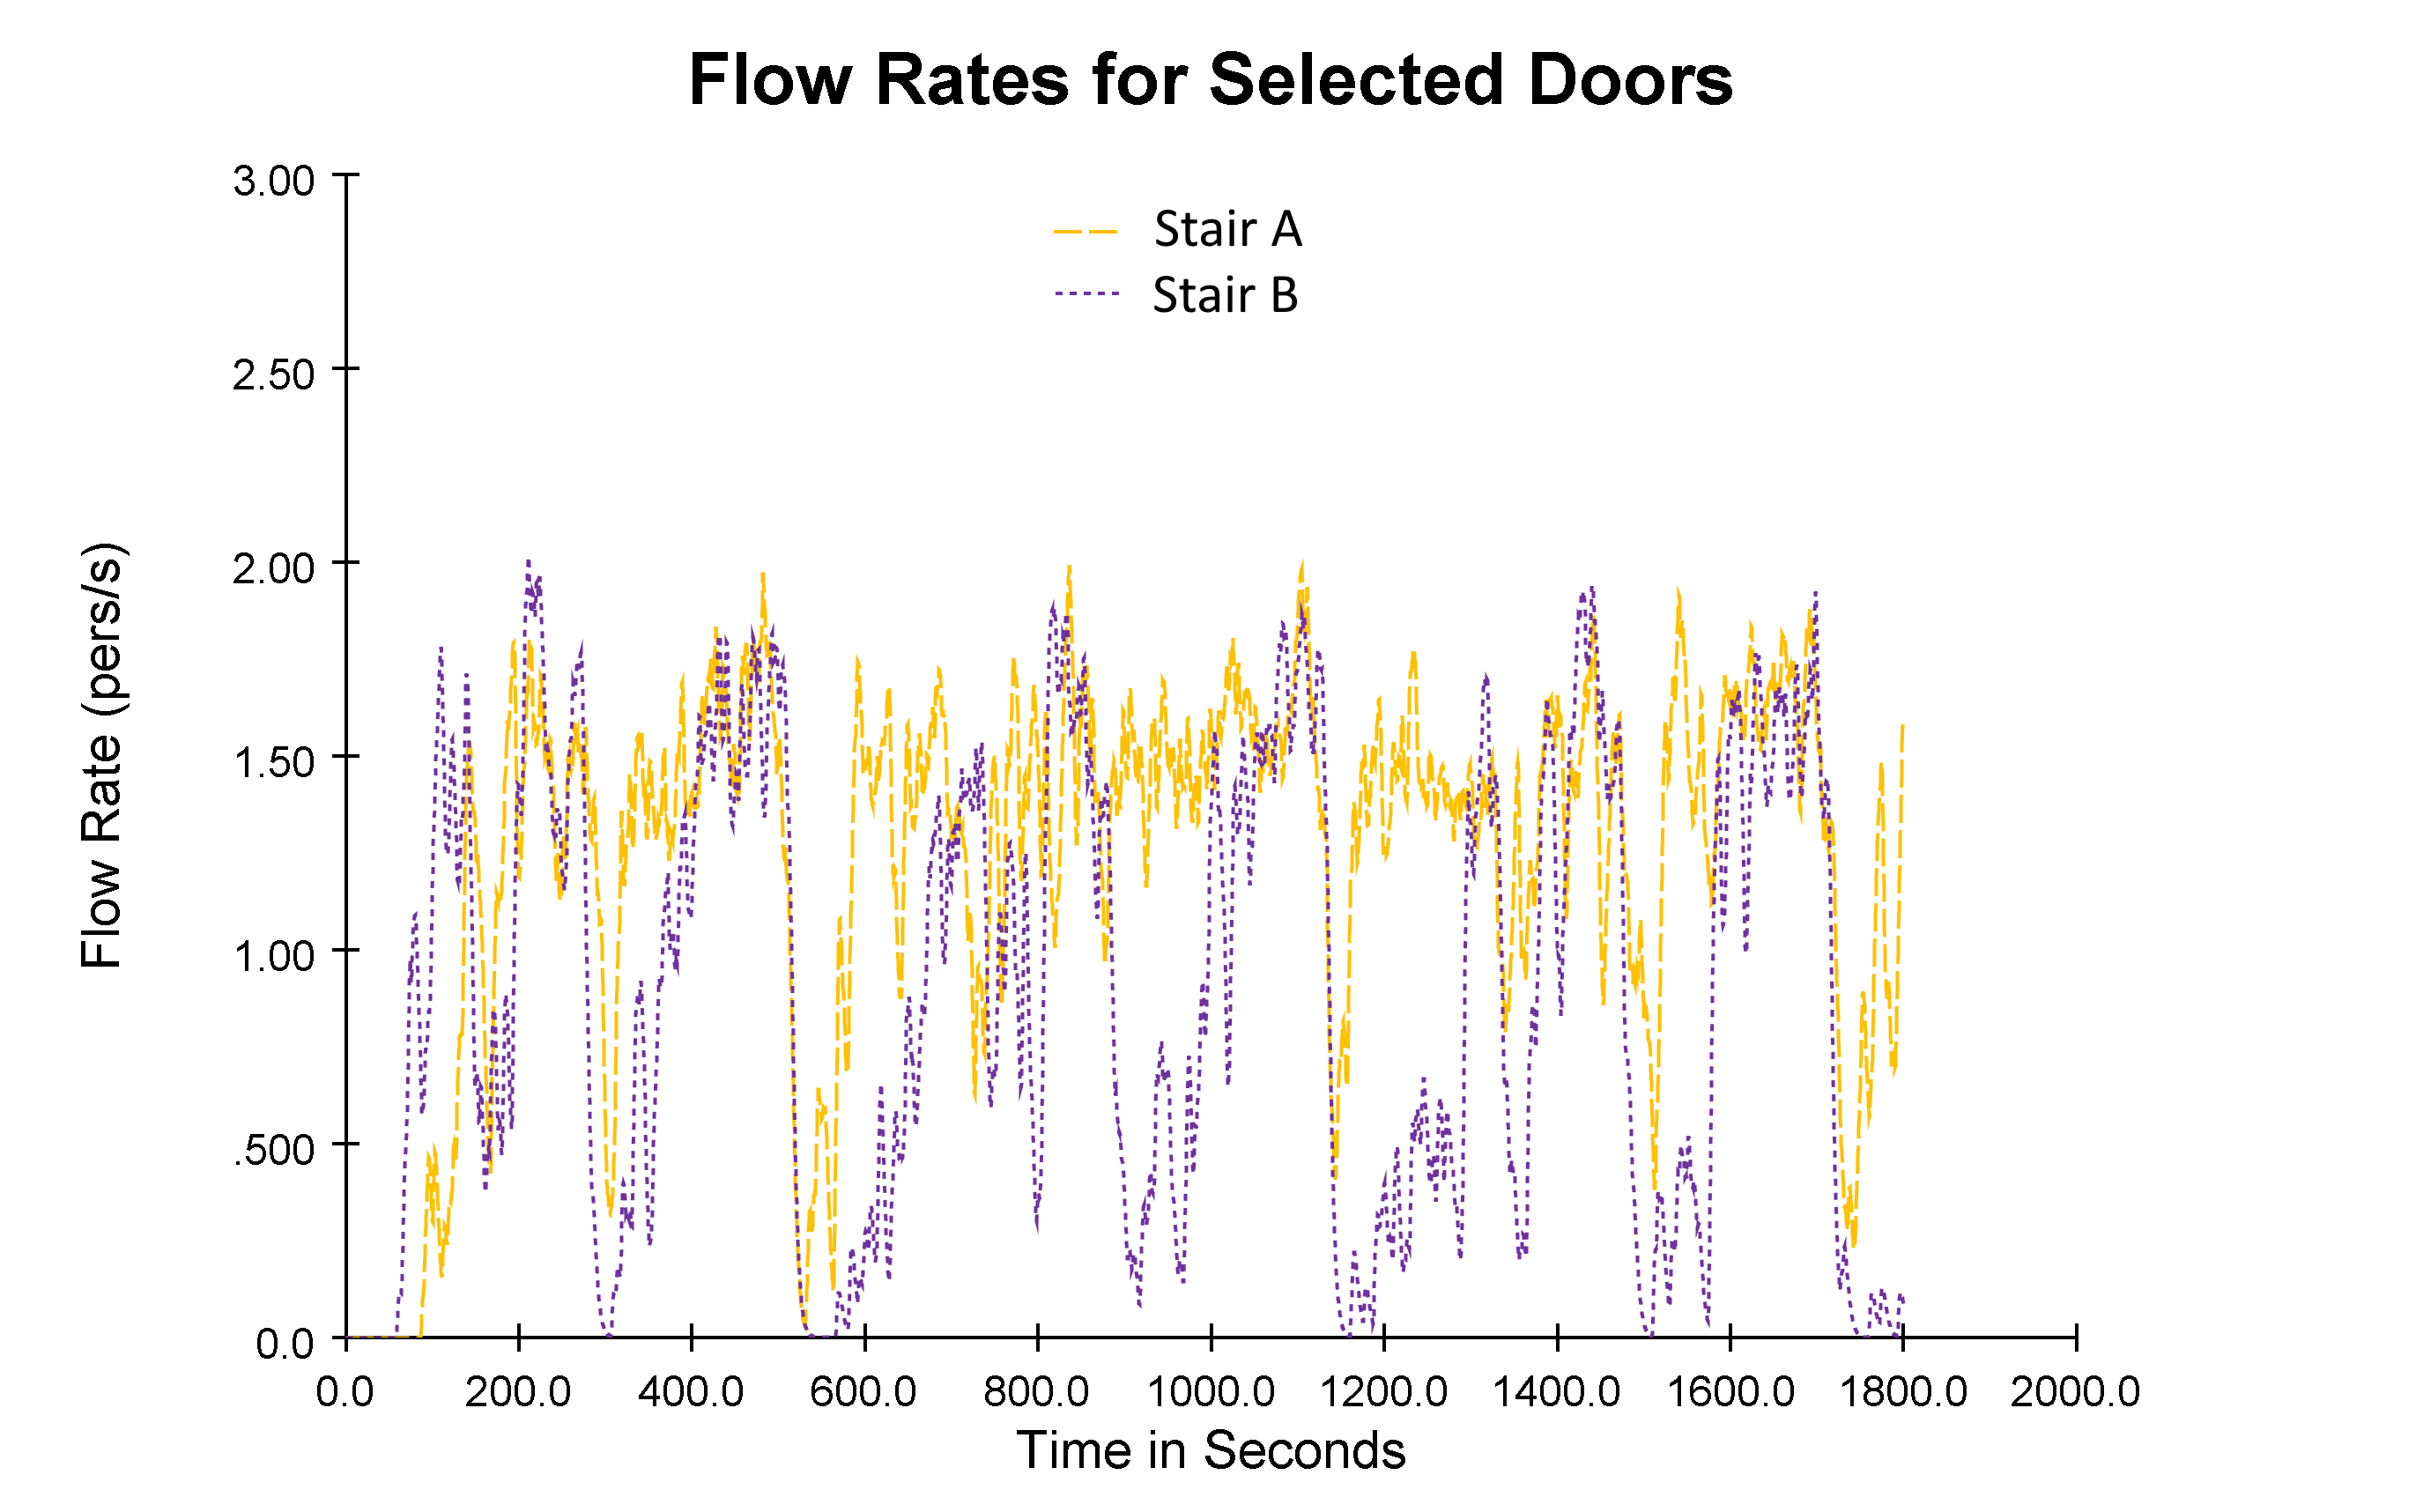
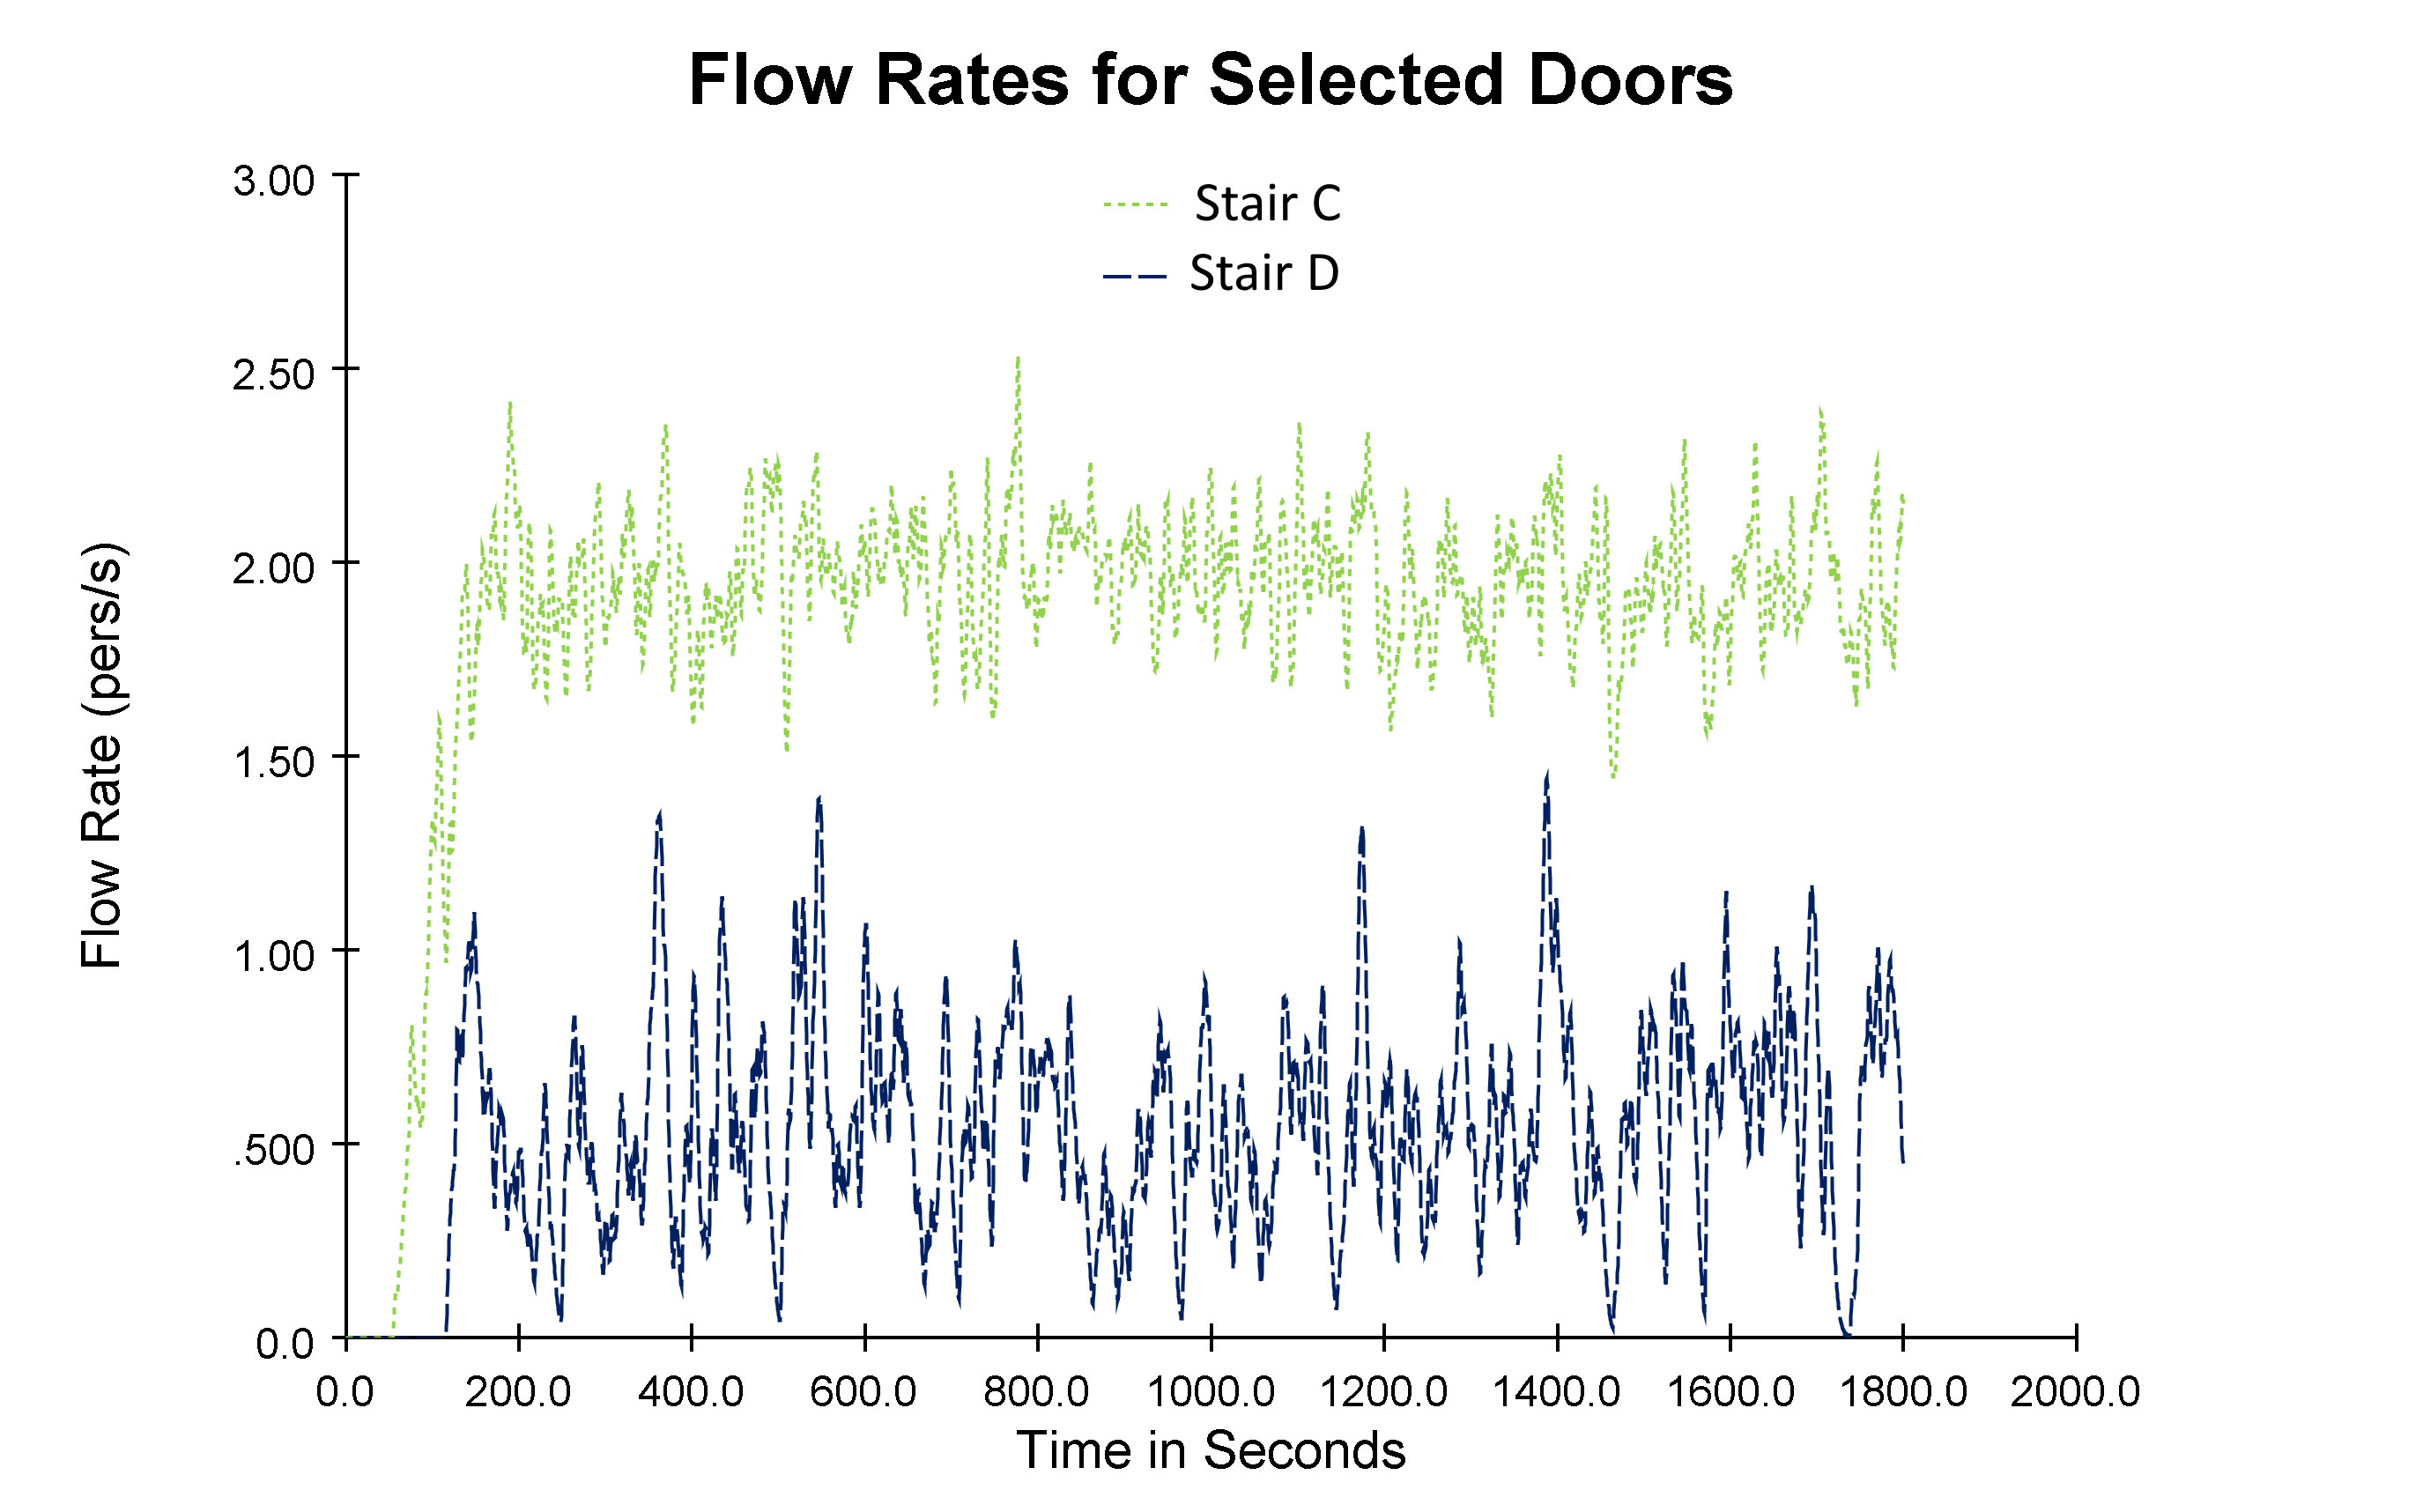
This is confirmed in plots of flow rates for the stairs.
Figure 14 shows the flow up in Stairs A and B, while Figure 15 shows the flow down in Stairs C and D.
For comparison, the maximum SFPE flow rate for these stairs is 2.4 pers/s.
The upward flow in Stairs A and B is cyclic and reflects the arrival of trains.
The peak flow rates on these stairs are about 1 pers/s.
The downward flow in Stairs C and D is more steady because of the steady arrival of passengers.
Stair C shows a relatively constant flow rate of about 2 pers/s.
Discussion
Changing Flow Direction Leads to Congestion
In the presented subway station model, the directions of flow of the turnstiles, stairs, and escalators were defined in Figure 7 to minimize crossflow between passengers heading to the trains and the passengers leaving the station.
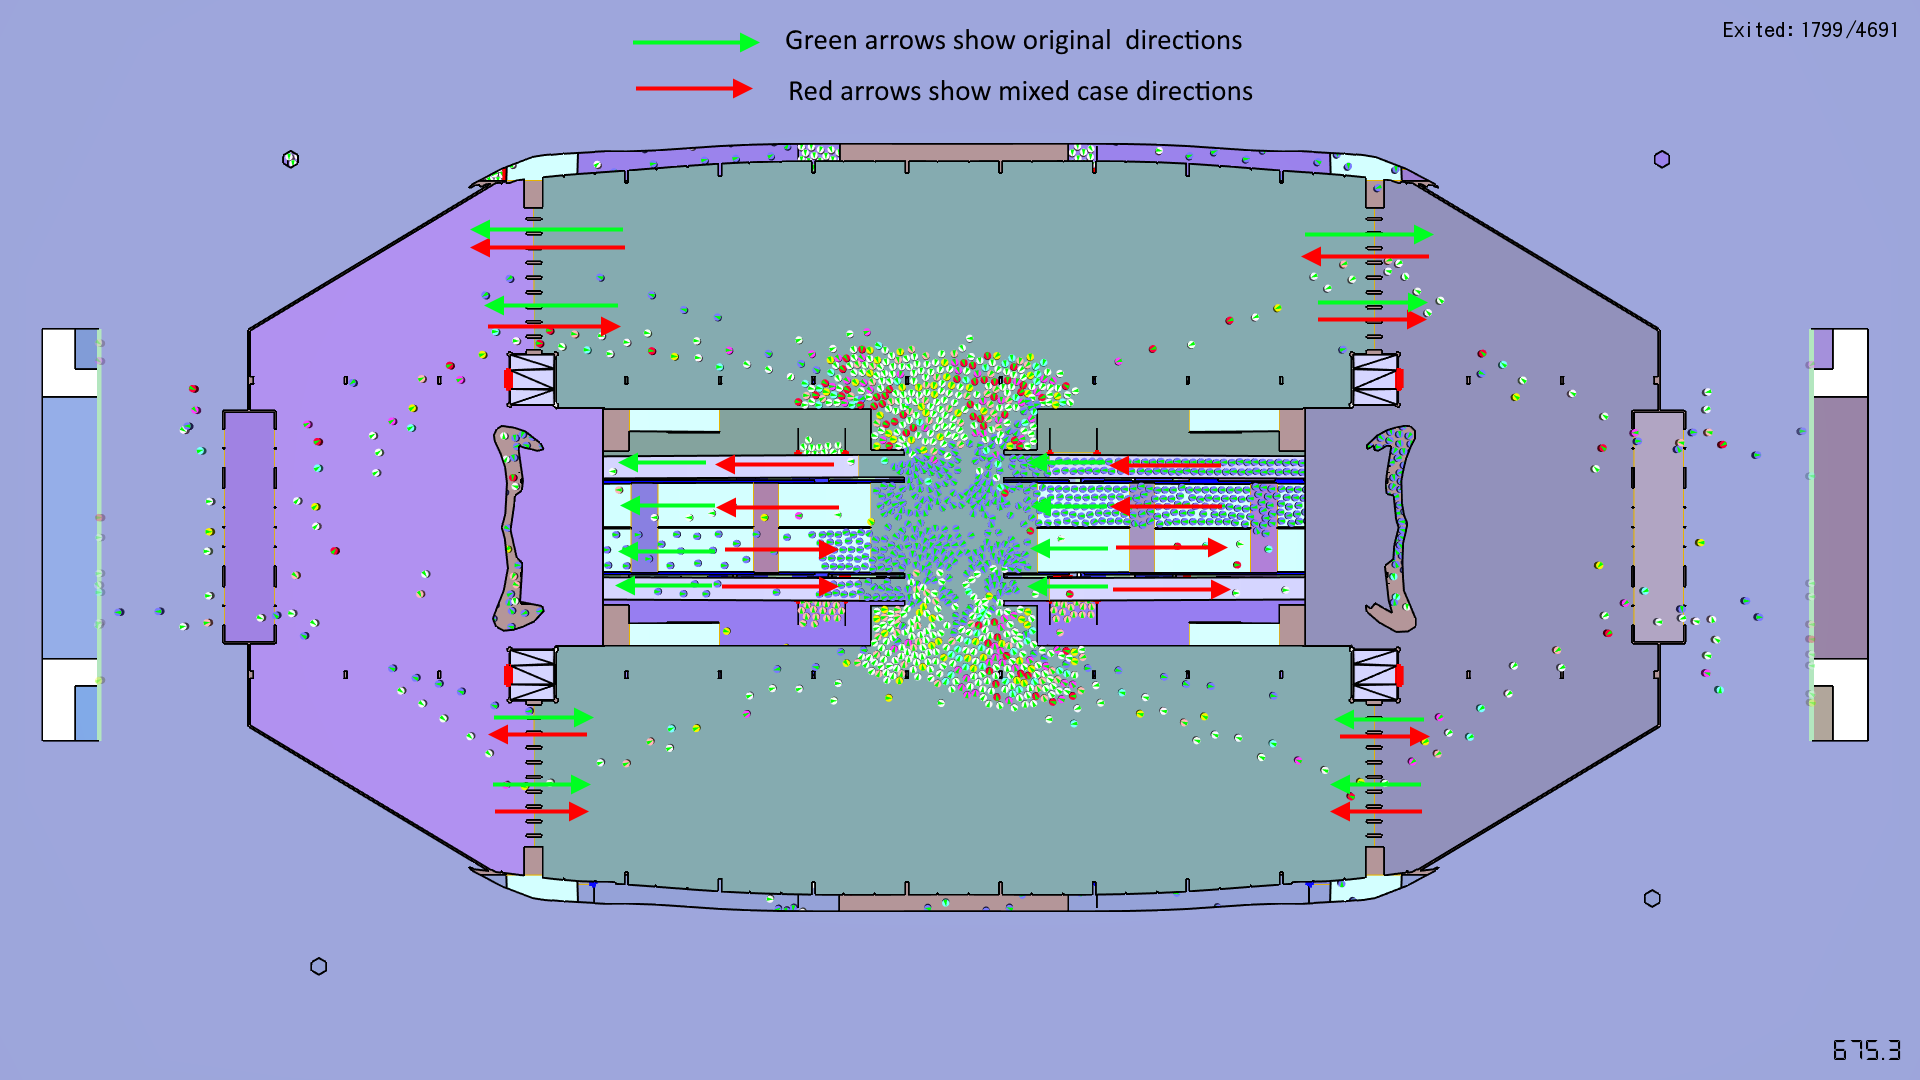
To examine the effect of changing the flow directions for movement between Level 30.0 m and Level 18.0 m, a case was run with the turnstile, stair, and escalator flow directions rearranged.
This case was run in Subway 10 mixed directions.pth.
The original and new directions of flow are shown in Figure 16.
Now the flow on the right half of the stairs/escalators is in a different direction than the left half.
The change in flow directions means that passengers attempting to go down to trains (mixed colors) must now cross the flow of passengers leaving the station (blue). The space between the stair entry/exit on the main floor is relatively small, so this crossflow leads to congestion.
The movement calculation in Pathfinder is optimized for evacuation, where counterflow and crossflow do not typically occur. The counterflow capability of Pathfinder is documented in the Validation and Verification Manual. The movement algorithm in Pathfinder does include some lane-forming capability, but in general, it is expected that Pathfinder will enhance the congestion in crossflow conditions. Experimental data on crossflow is sparse, so it is difficult to rigorously evaluate the simulation. In one sense, enhanced congestion could also be considered an asset, since it means that the Pathfinder results are conservative.
Uniformly Distributed Speeds
In the presented subway station model, speeds were constant for all occupants. For each profile, the dialog looked like Figure 17, with a constant speed assigned to everyone.
Assigning a statistical uniform distribution of speeds to occupants would better represent real life.
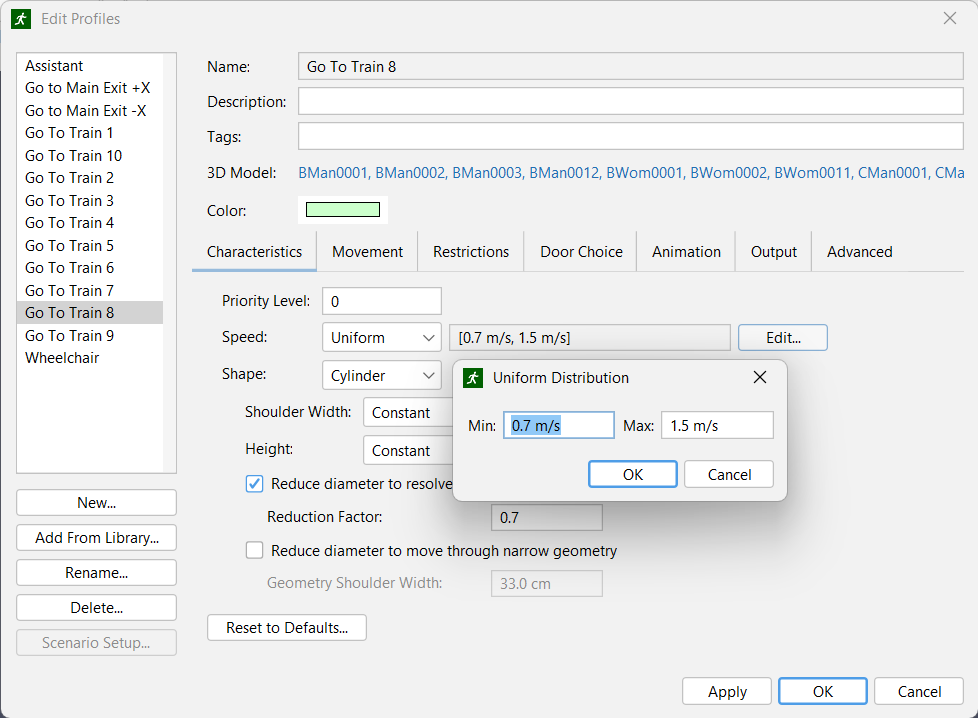
You may wish to define speed with a uniform distribution having bounds of 0.7 m/s and 1.5 m/s; this range broadly covers the walking speed for most populations (IMO 2007).
The uniform distribution can be applied to each profile within the dialog, as in Figure 18.
The model Subway 10 final distributed speeds.pth is provided to demonstrate the adaptation of uniformly distributed movement speeds.
Conclusion
In this post, we demonstrated how to use Pathfinder to simulate movement in a subway station. The model and results show:
- The use of Occupant Sources makes it possible to simulate passengers exiting trains at specified time intervals. Occupant Sources also support the continuous entry of passengers to the station.
- The flow of passengers and the use of stairs and escalators were consistent with the expected behavior.
- Peak flow rates on stairs approached the expected SFPE maximum flow rates.
Pathfinder makes it possible to study congestion that can result from inadequate or poor design choices.
Since this is a newer area of application of Pathfinder, we would appreciate comments and suggestions from pedestrian movement engineers. Please contact support@thunderheadeng.com.
Bibliography
IMO. 2007. “IMO Guidelines for Evacuation Analysis for New and Existing Passenger Ships.” 4 Albert Embankment, London, Great Britain: International Maritime Organization.
Appendix
Modeling Hints and Video Tour
This Subway Modeling Hints video demonstrates using tools that can speed model creation and editing. The final video provides a video tour of the results for Subway 10 final.pth.
To download the most recent version of Pathfinder, please visit the Pathfinder Support page and click the link for the current release. Please contact support@thunderheadeng.com with any questions or feedback regarding our products or documentation.
Version Control
In accordance with the Thunderhead Engineering SQAP, the zip folder was updated when relevant Pathfinder features changed.
The current files in the zip folder are:
- station-conceptual-model.pth, a small conceptual model created in Pathfinder 2017. It was updated with Pathfinder 2024-2 and renamed from test arrival and departure.pth to station-conceptual-model.pth. This model is presented in the section Conceptual Model.
- Subway 10 final.pth, the large model presented and discussed throughout the main tutorial section, Subway Model. Version 10 of the model. This Model includes camera tours that are view-only with modern Pathfinder programs.
For Pathfinder 2018.3 and later, we create the camera tour in the 3D Results program. In earlier versions, the camera tour could be created and saved in Pathfinder as part of Views. Tours created in Pathfinder 2018.3 and earlier remain accessible in Results as view-only camera tours.
- Subway 10 final distributed speeds.pth, the large model discussed in the earlier section, Uniformly Distributed Speeds. Version 10 of the model. This Model includes camera tours that are view-only with modern Pathfinder programs.
- Subway 10 final mixed directions.pth, the large model discussed in the earlier section, Changing Flow Direction Leads to Congestion. Version 10 of the model. This Model includes camera tours that are view-only with modern Pathfinder programs.
Related Tutorials
Update to a Pathfinder subway station passenger movement, using queues and triggers to simulate standard circulation, then an emergency evacuation.
Video tutorial demonstrating the variables that may have an effect on evacuation time from aircraft cabins.
Video tutorial demonstrating how to effectively simulate evacuation of theaters and stadiums using Pathfinder.
Video tutorial demonstarting how to assign exit goals to percentages of the occupant population.
Tutorial demonstrating the evacuation of a hospital
Tutorial to experience the fundamental features of Pathfinder with a mixed purpose multi-floor building
(Legacy) Tutorial to experience the fundamental features of PyroSim
Video tutorial demonstrating the difference in evacuation times when occupant flow is properly balanced.