You can follow along with this post by downloading the file smoke-effects.zip here.
Introduction
A long-term development goal has been to fully couple the PyroSim/FDS fire results with Pathfinder evacuation. A first step toward this goal is the capability to display both fire and evacuation results in the same results viewer. However, full coupling of the two simulations has not been completed. In the interim, it is possible to run the fire simulation, monitor the reduced visibility due to smoke, and then manually use that information to slow and re-direct occupants in response to the fire. This post provides an example of this process.
Walking Speed as a Function of Visibility
We will use visibility to slow the walking speed of occupants. To do this, we will measure visibility at different locations in the PyroSim/FDS model. The measurements will be located in the evacuation path. A local speed factor will be calculated as a function of time using the measured visibility at that location. The occupants will then slow their speed and adjust their paths using these speed reductions.
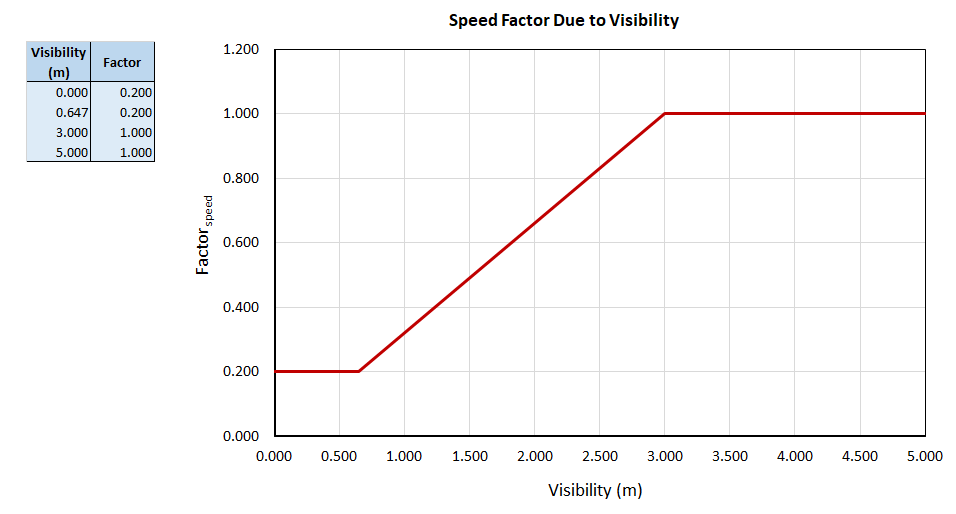
Walking Speed in Smoke: Representation in Life Safety Verifications (Fridolf et al. 2018) gives a function of walking speed as a function of visibility. In the paper, they use this as absolute walking speed, but we will treat this as a factor that slows the speed of each occupant. Their relation is given by Speed Slowing Factor:
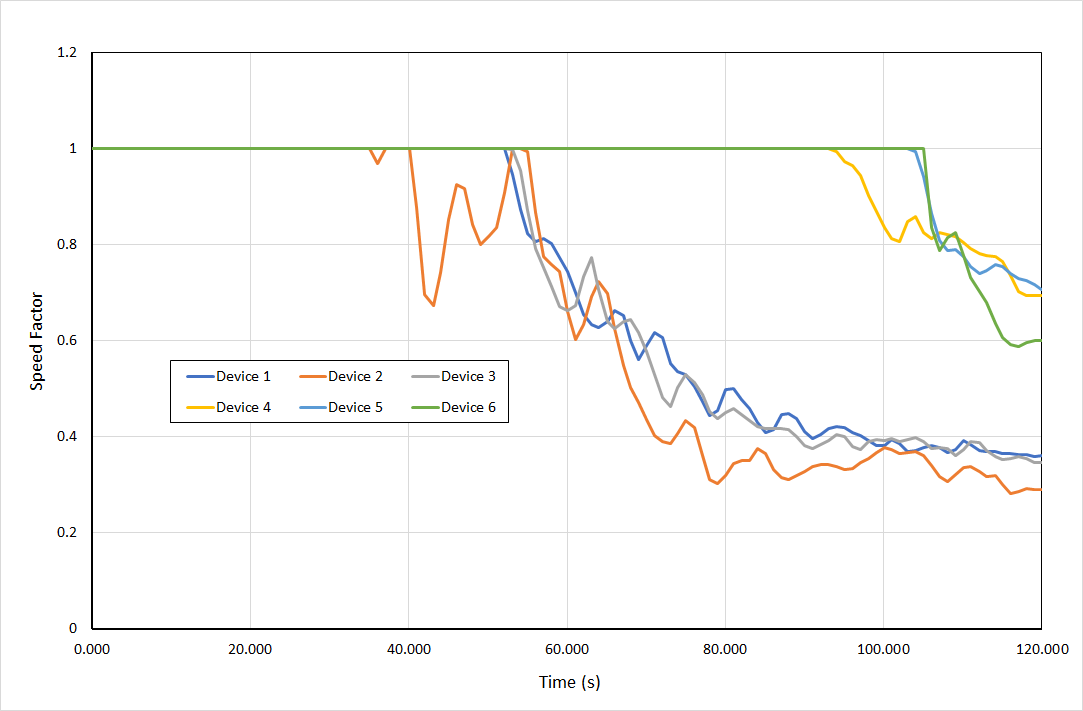
The speed factor is tabulated and shown in the graph below.
Fire Simulation
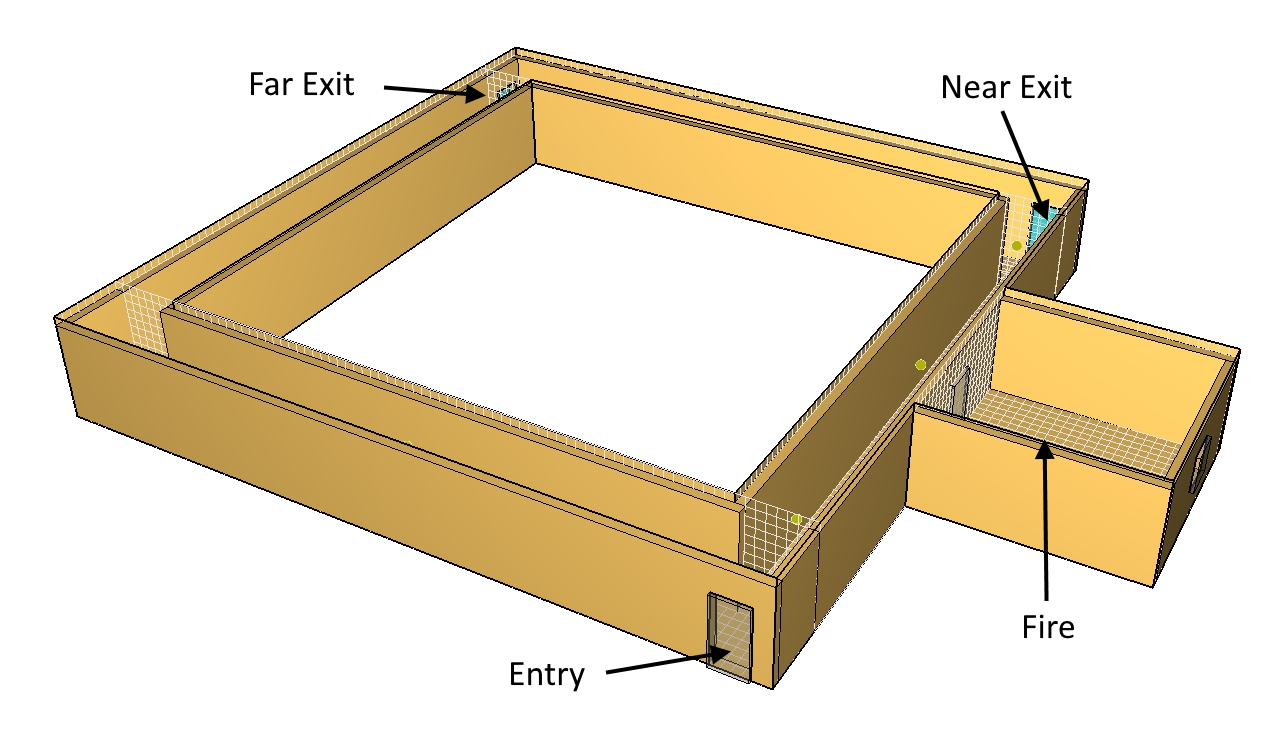
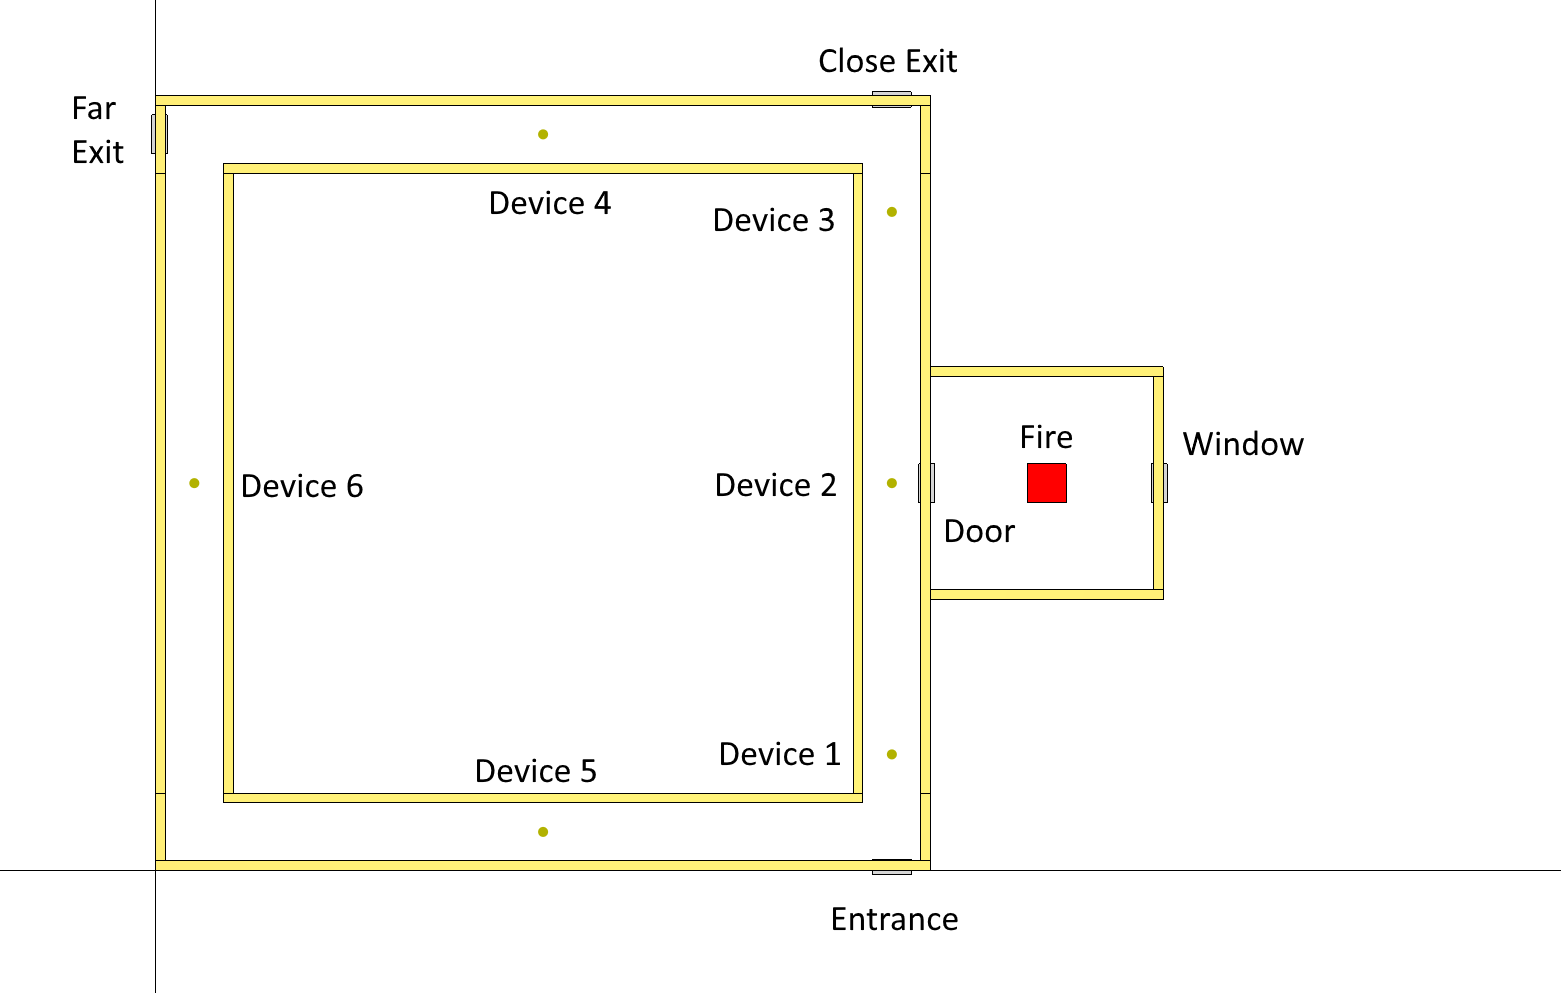
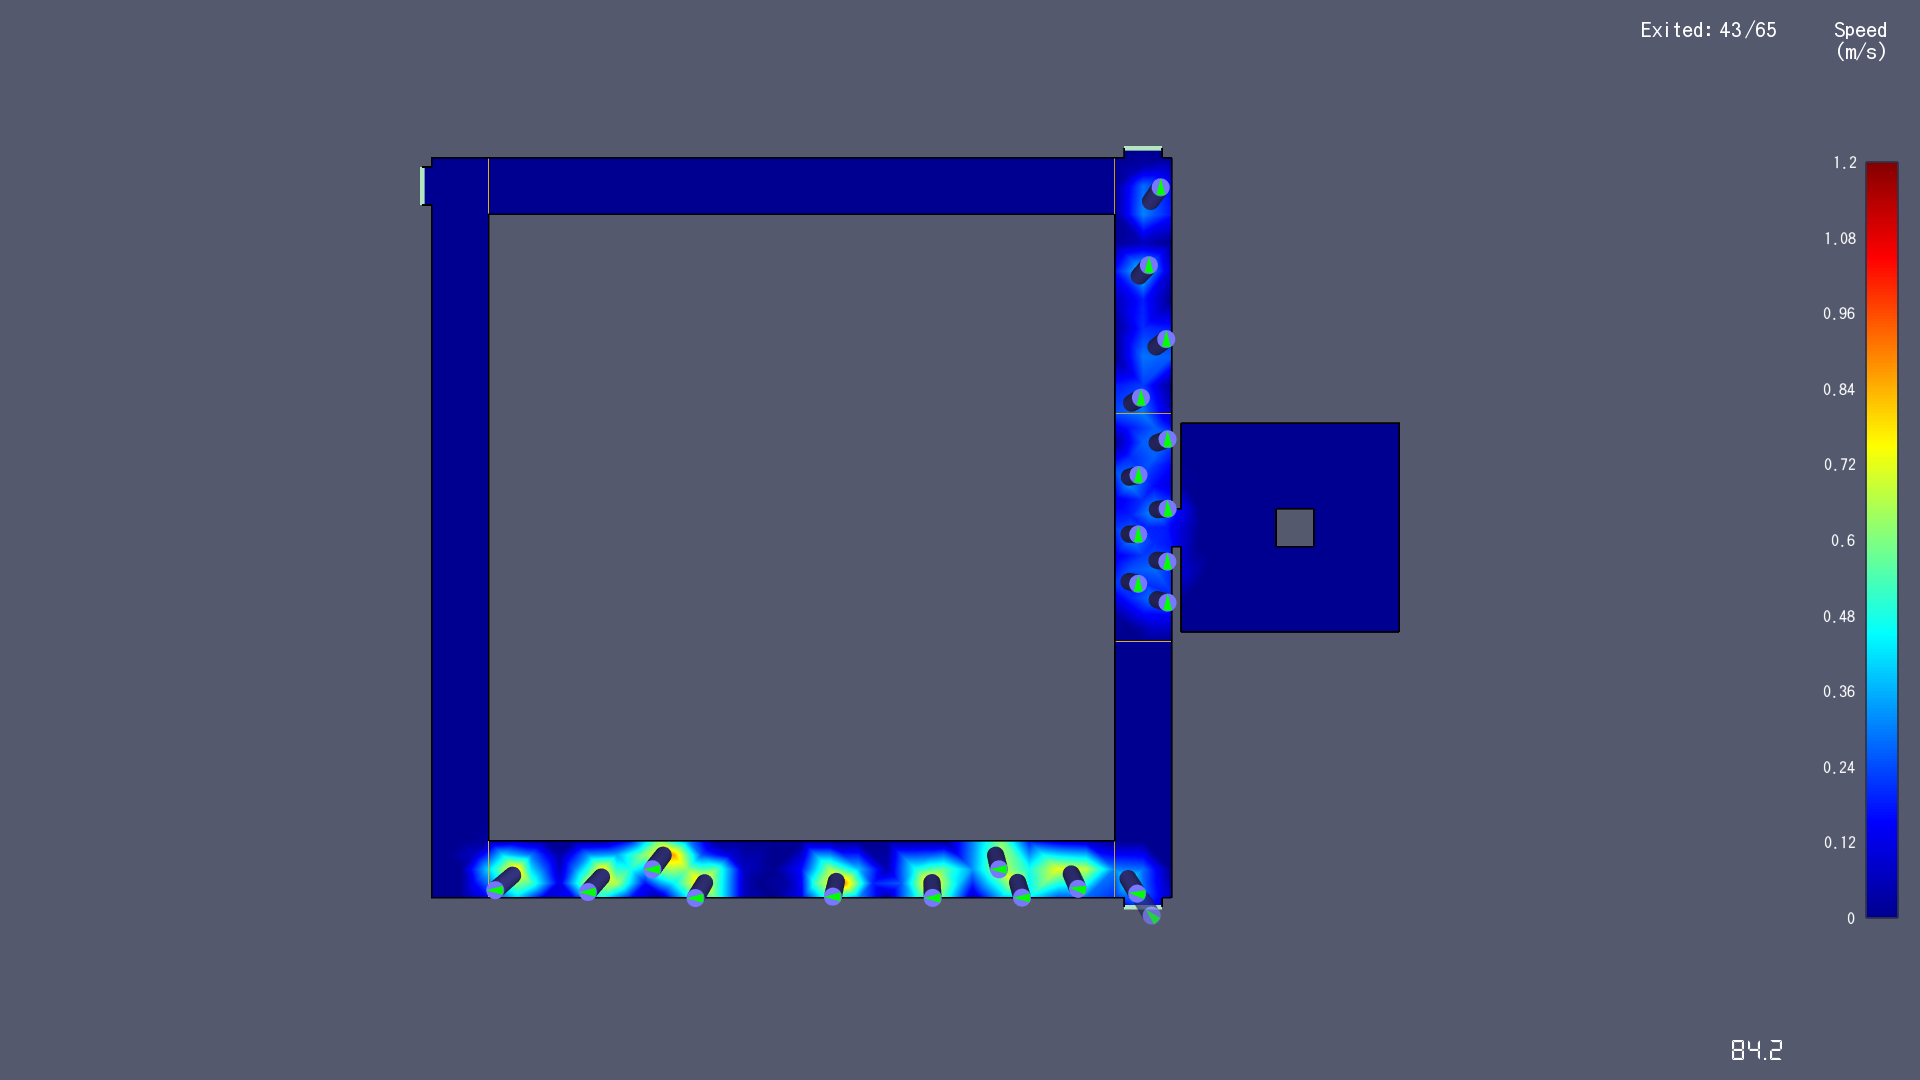
The fire model we will use for this example includes a room with a fire and a door that connects to a hallway. Occupants enter and then choose between two exits. At first, they use the nearest exit, but as the smoke slows their local velocity, they will choose to exit from the further exit. Figure 2 shows the geometry of fire simulation and Figure 3 shows the location of the devices that measure visibility. These were positioned at 2 m height. The fire is a 200 MW fire that ramps to full value at 60 seconds.
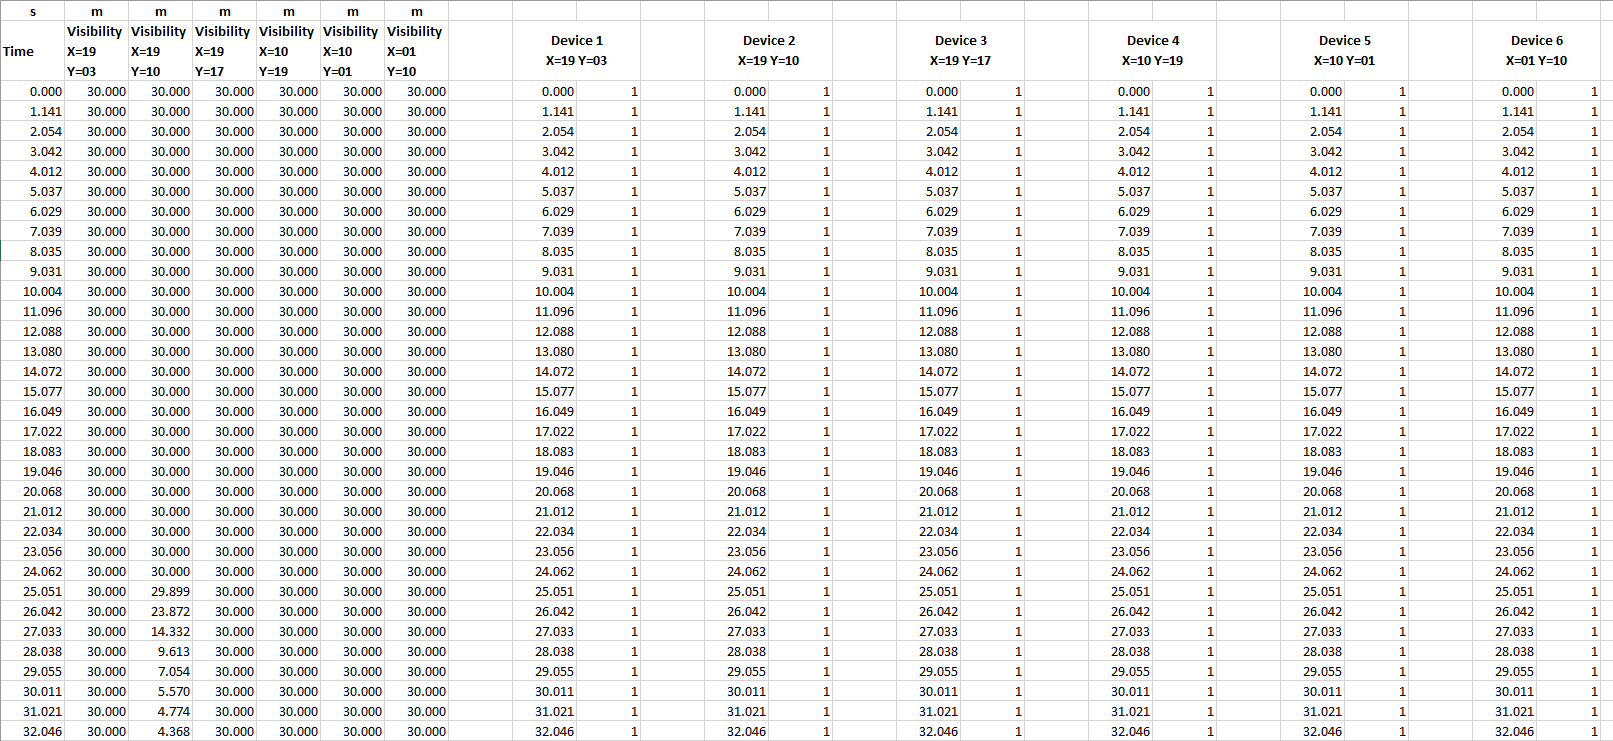
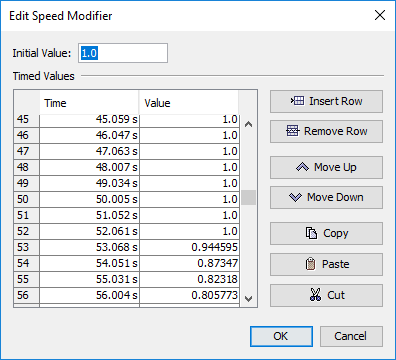
Visibility measurement devices output data to a *.csv file. In PyroSim, on the Analysis menu, click Simulation Parameters. Click the Output tab and set the Device write interval to a value that will result in a reasonable number of data points in the *.csv file (I used a 1 second interval for a 120 second simulation). After the simulation, open the *.csv file and use the equation shown in Speed Slowing Factor to calculate the speed factor as a function of time based on the visibility. Figure 4 shows part of a spreadsheet that does this calculation. Figure 5 plots the speed factors.
Evacuation Simulation
We import the PyroSim model into Pathfinder and extract the floor, add the entrance and exit doors, then we divide the floor into rooms that correspond to the device locations we used to measure visibility. We then connect these rooms by doors, select a room, and edit the speed modifier using the data calculated in the spreadsheet, as shown in Figure 6.
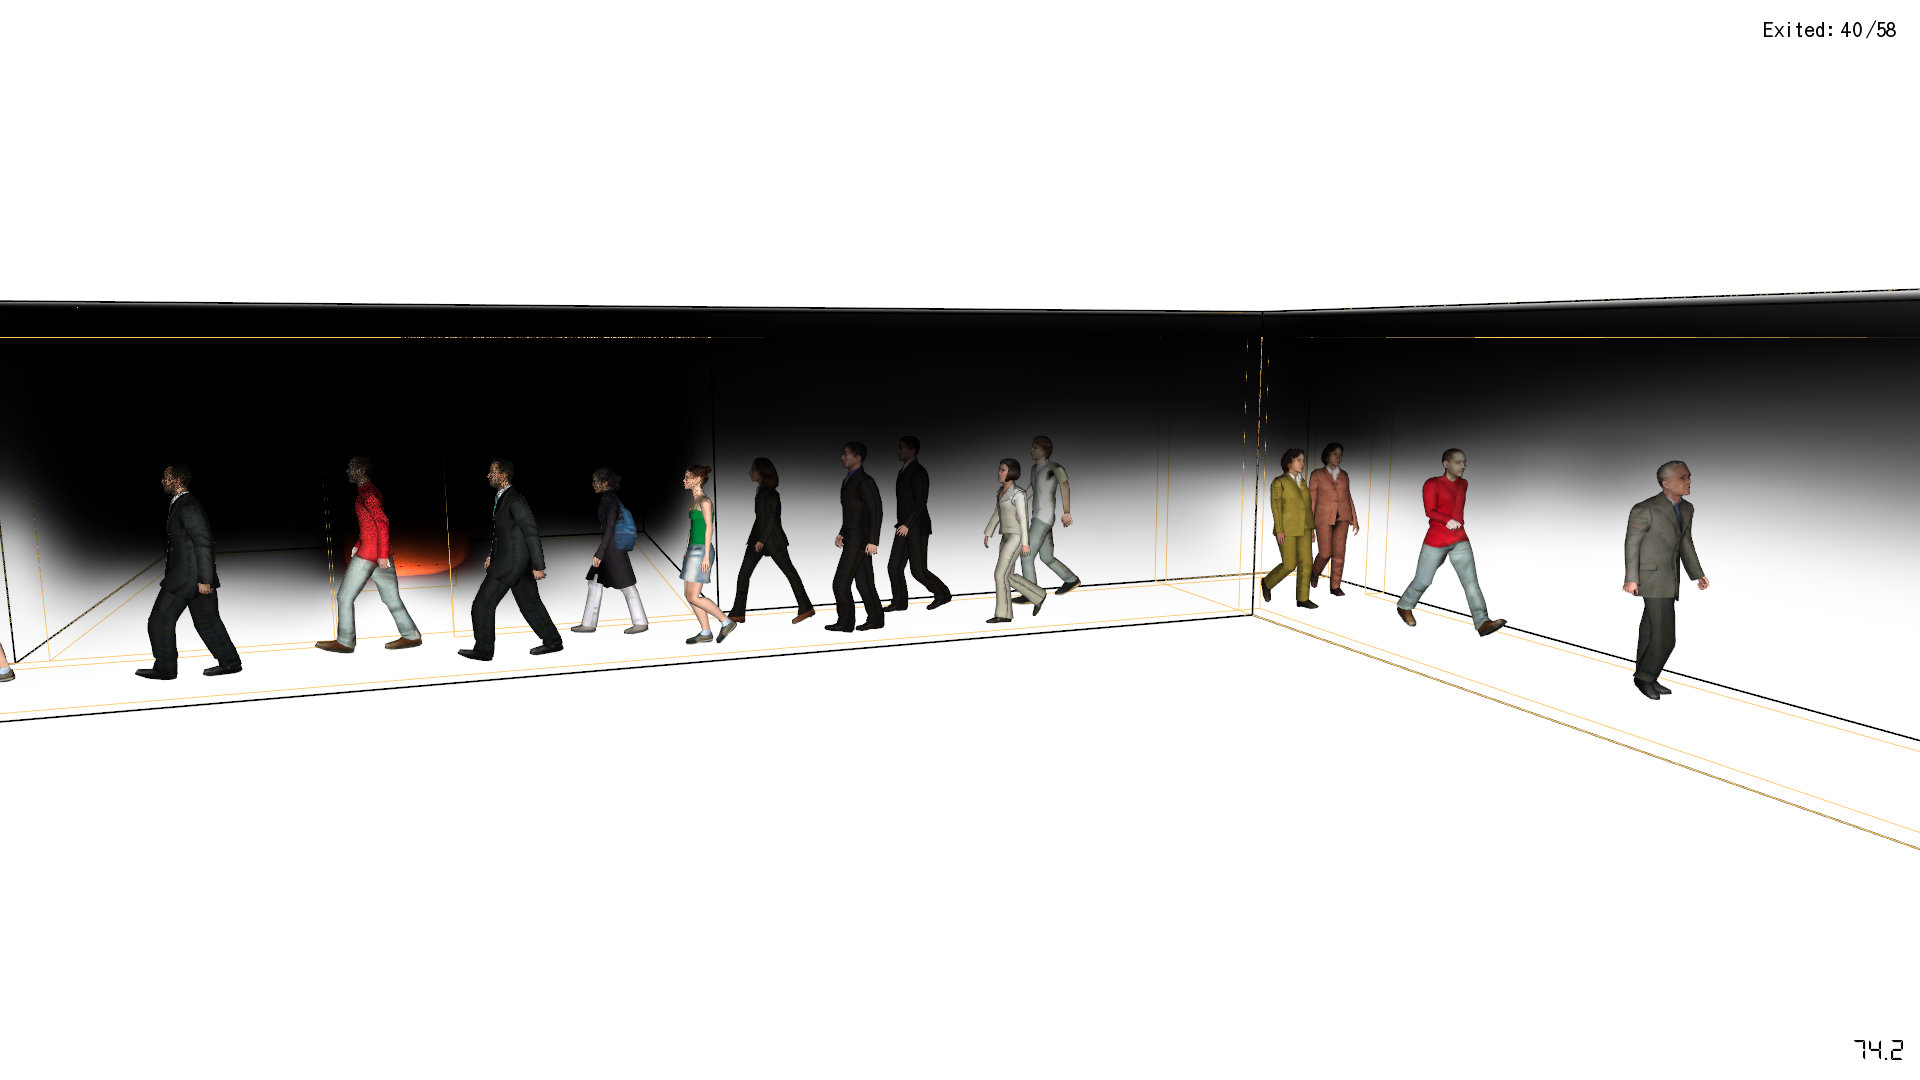
We are then ready to run the simulation. As first the occupants enter, they walk past the room with the fire, and exit using the closest exit. At about 70 seconds, the occupants start to use the farther exit. This is because the occupants recognize that their speed in the hallway is slowed due to the smoke and that the further exit would be faster. Figure 8 shows the occupants with smoke displayed soon after it becomes better to use the further exit.
Summary
This post has demonstrated a manual approach to link fire simulation output with evacuation simulation movement. In this case, visibility was used to change the walking speeds. This resulted in occupants choosing a different (longer) evacuation route. The user also has the option to completely prevent entry into a room (or through a corridor section) by closing doors at any time in the simulation.
This manual coupling is clearly not automatic, however it does demonstrate a work-around that is currently available.
To download the most recent version of Pathfinder, please visit the Pathfinder Support page and click the link for the current release. If you have any questions, please contact support@thunderheadeng.com
Bibliography
Fridolf, Karl, D Nilsson, H Frantzich, E Ronchi, and S Arias. 2018. “Walking Speed in Smoke: Representation in Life Safety Verifications.” The 12th International Performance-Based Codes and Fire Safety Design Methods Conference.
Related Tutorials
Tutorial demonstrating how to merge PyroSim results with Pathfinder movement.
How to simplify post-processing data collection with seasonal scenarios and scheduled stairwell temperatures.
Tutorial demonstrating how to model critical velocity in Pyrosim using the example of a tunnel fire.
Tutorial demonstrating how to verify HVAC Pressure Drop in Pyrosim.
Tutorial demonstrating how to model Heat Conduction in Pyrosim.
Tutorial demonstrating how to refuge floors, firefighters, and elevators
(Legacy) Tutorial to experience the fundamental features of PyroSim
To demonstrate basic Ventus capabilities, we will model a simple six-story building for winter and summer conditions.