To follow along with this tutorial, you should download the files group-template-distributions-1.0.zip, The-Art-Center-grouped-auditorium-1m-post.pth, and two-groups.pth.
Introduction
In Pathfinder 2018.1, occupants can be assigned to groups that move together during the simulation. Some scenarios in which groups could be important include:
- Situations where members of a group are initially separated, they meet, and then evacuate together (e.g. evacuation of separated group from multiple rooms)
- Movement where groups are initially near each other and remain close during evacuation (e.g. evacuation of families and couples from an auditorium).
In this post, we illustrate both of these cases.
Background
As described in the Pathfinder Pathfinder User Manual, "Grouped movement is controlled by two concepts: connected state and the group leader. If a group is in a "disconnected" state, occupants will walk toward the leader. If a group is in a "connected" state, occupants move toward the goal dictated by their behavior." A group is disconnected if the distance between one part of the group and another part exceeds the Maximum Distance for that group. If the group is disconnected, the leader will slow to a stop in the time interval defined by the Slowdown Time. Once the group has reformed, they will move at the speed of the slowest member of the group.
Figure 1 shows a model with four groups. The Maximum Distance for each group is 1.5 m. The members of each group are arranged on a 1 m grid, with distances between members of 1 m or 4 m, so some of the groups are initially connected and some disconnected. The Slowdown Time is 1 sec. The groups move toward the exit on the right.
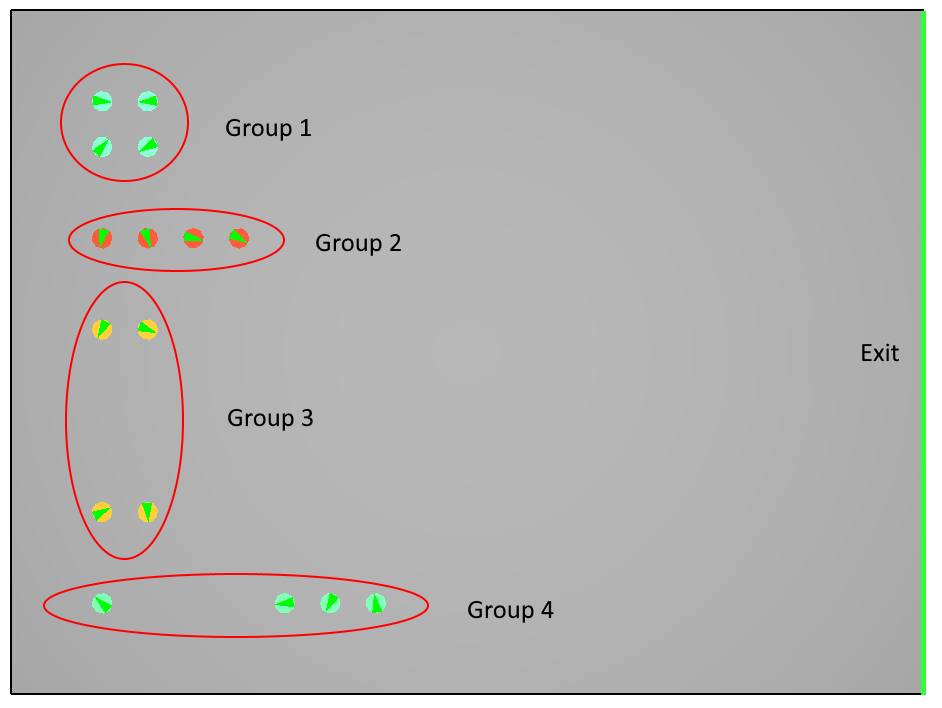
Figure 2 shows the groups moving toward the exit. Pathfinder was run in debug mode so that the color of each member indicates the current member state. Green indicates the leader, blue indicates a following member when the entire group is connected, orange indicates a following member connected to the leader but when some members of the group are disconnected, and red indicates a following member disconnected from the group. Initially groups 3 and 4 are disconnected. The leaders of groups 3 and 4 slow to a stop, waiting for the disconnected members to merge with the group. They then move together as a group.
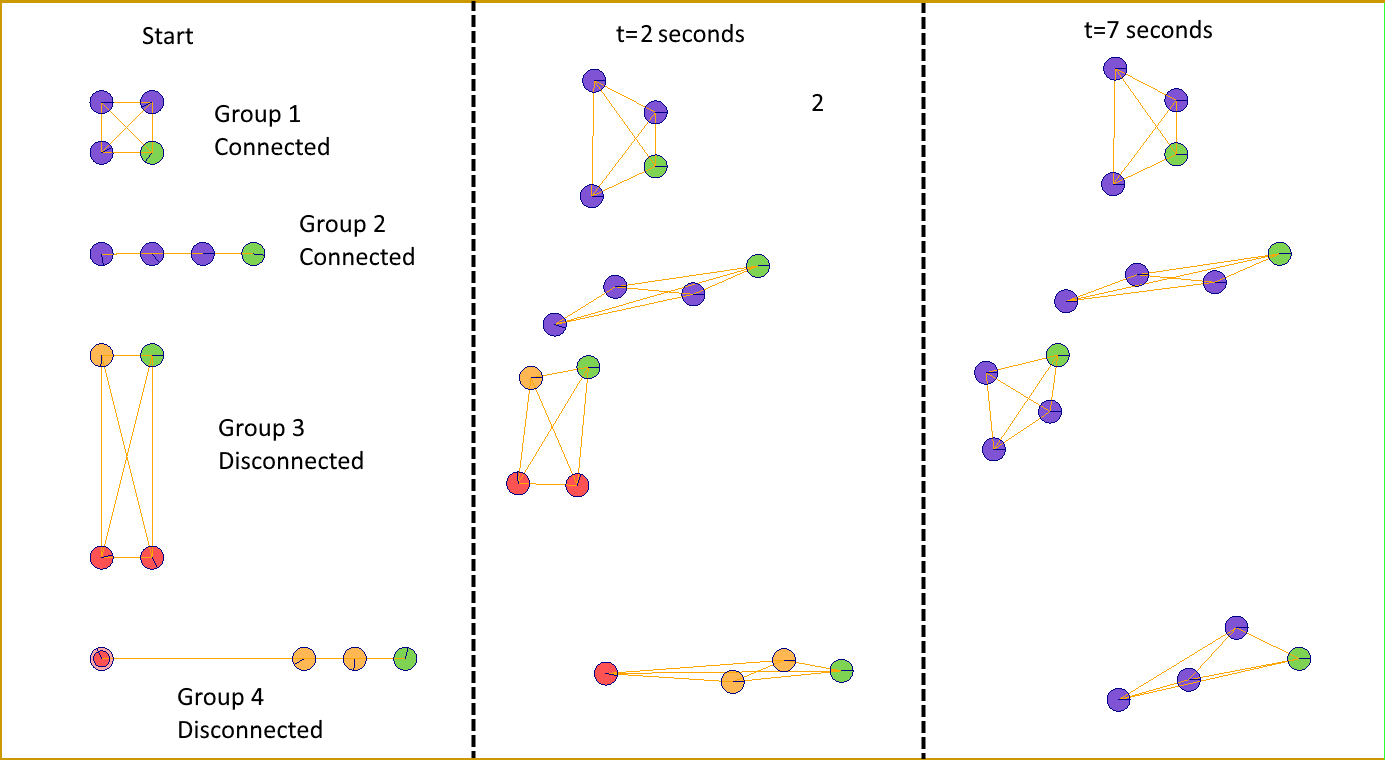
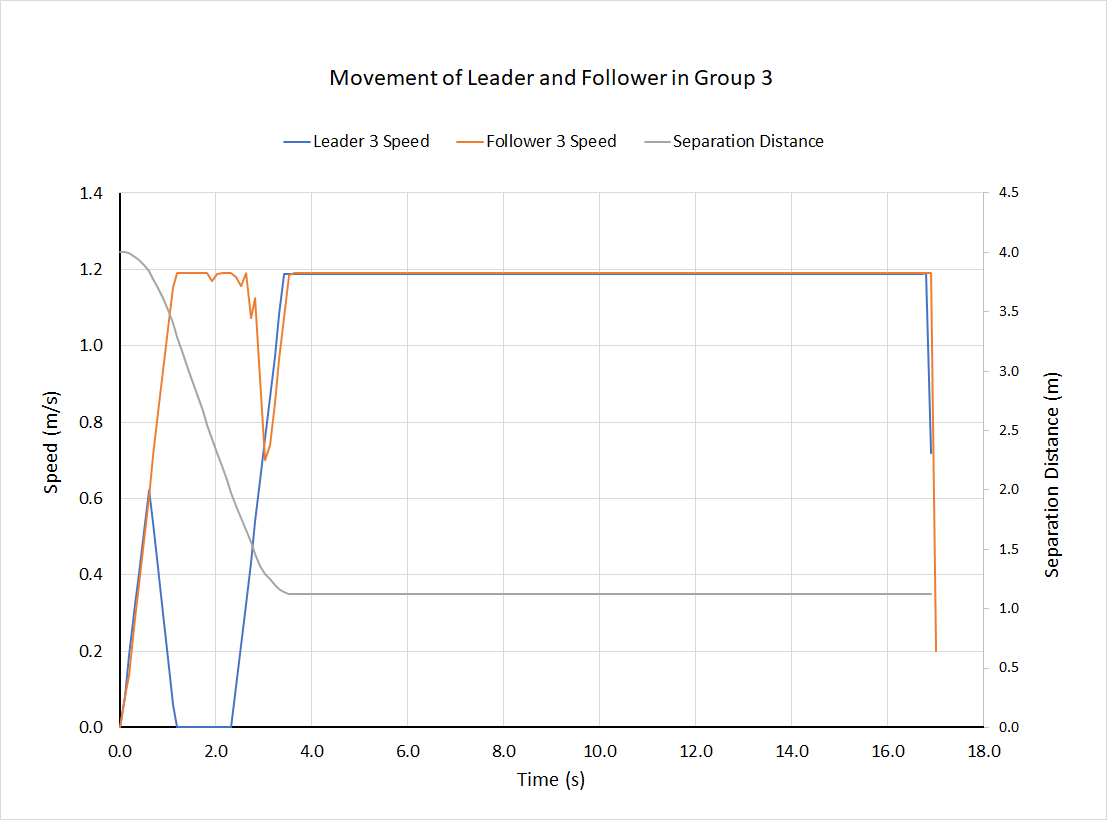
Figure 3 shows the velocities and separation distance between the leader of group 3 and the follower initially located 4 m below the leader. When the leader recognizes the group is disconnected, the leader slows to a stop in 1 second. When the group reconnects, the leader and group move together. The separation distance between the leader and the follower is about 1.2 m, indicating that separation distance during movement will typically be somewhat less than the Maximum Distance. The shape of the moving groups and the distance between members is not specified, but develops based on the positions of the members when the group reconnects.
If a group leader is moving in a crowd and the group becomes disconnected, the leader does not slow down and block movement. Instead, the leader moves with the crowd and slows down only when the crowd becomes less dense. While the group is disconnected, the followers in the group will continue to move toward the leader. As a result, a group can become temporarily disconnected in crowds and will not reconnect until the crowd is less dense.
Example 1: Initially Separated Groups
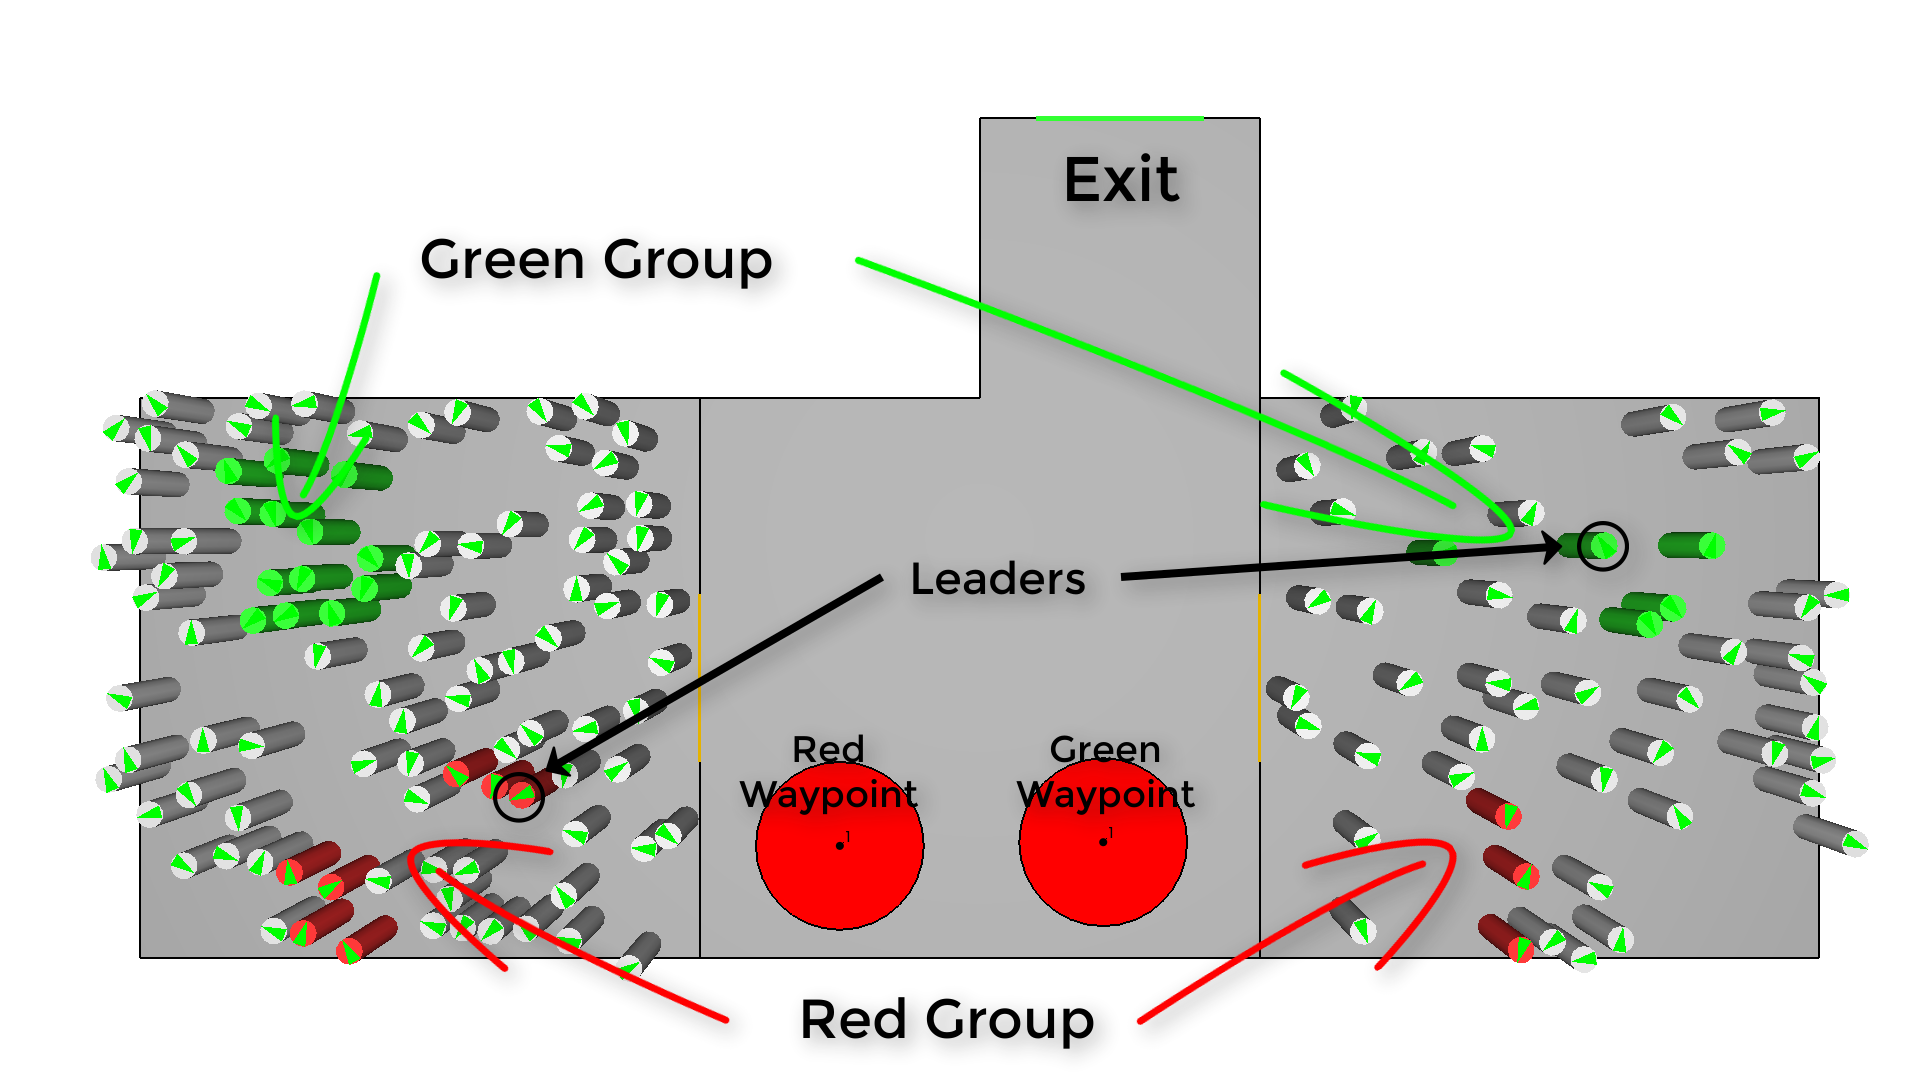
The first example is the case where two groups are initially separated, shown in Figure 4. When evacuation begins, each group assembles and then proceeds to the exit.
The groups and group leaders were assigned manually.
The red group’s behavior is to move to their meeting point, wait until time reaches 45 seconds, then proceed to the exit.
The green group goes to their meeting point, waits until 60 seconds, and then goes to the exit.
A uniformly distributed initial delay of 0 to 15 seconds is assigned to each occupant.
The free walking speed of each occupant is also uniformly distributed between 1.0 m/s and 1.4 m/s.
Group movement is important when the members are moving and must maintain a connection distance with other members. In this example, group movement has little initial effect when members are moving towards their meeting points, except for a short time when the leader of the green group stops and waits for some members to join before proceeding to the gathering point. However, when the groups leave the meeting point, the group members follow the leader, move at the speed of the slowest member of the group, and stay in close contact.
The video below presents the simulation. Part of the video displays debug mode, where the connections between members of each group are displayed.
Example 2: Grouping in an Auditorium
This example examines the effect of groups on the evacuation time of an auditorium. Because the groups attempt to stay together, it takes longer to exit than when there is no grouping.
Before proceeding with the description of the calculation and results, two points need to be made that are specific to this model that uses different sized groups and represents each row as a room.
Different Sized Groups: In the 2018.1 release of Pathfinder, the user specifies the percent distribution of templates. Groups are then created to match the desired group distribution. If the groups have different sizes, the resulting occupant distribution will be different than the group distribution.
For example, if there are two uniformly assigned group templates of 1 and 4 members, half of the groups will have 1 member and half will have 4 members, so 20% of the people will be in a group of size 1 and 80% in a group of size 4. Many users may want to specify occupant distribution, not the group distribution. A spreadsheet to calculate the group distribution that gives a desired occupant distribution is available for download at the top of this post. In this example, to distribute 30% of the people in a group of 1, 40% in a group of 2, and 30% in a group of 4, the group distributions should be 52.2%, 34.8%, and 13%.
- Small Rooms: The auditorium seating is in rows. In Pathfinder, it is recommended that each row be represented as a separate room. So the auditorium has many small rooms. When defining groups, we select the Restrict Members to Same Room option to keep groups together in the same row. The algorithm that assigns groups selects a group, then checks to see if that group can fit in the room. If that group fits, it is added; if not, another group is selected. This algorithm works well for large rooms with many groups. When filling a small room, it introduces some bias to select smaller groups, since larger groups will be rejected if they cannot fit into a nearly full room.
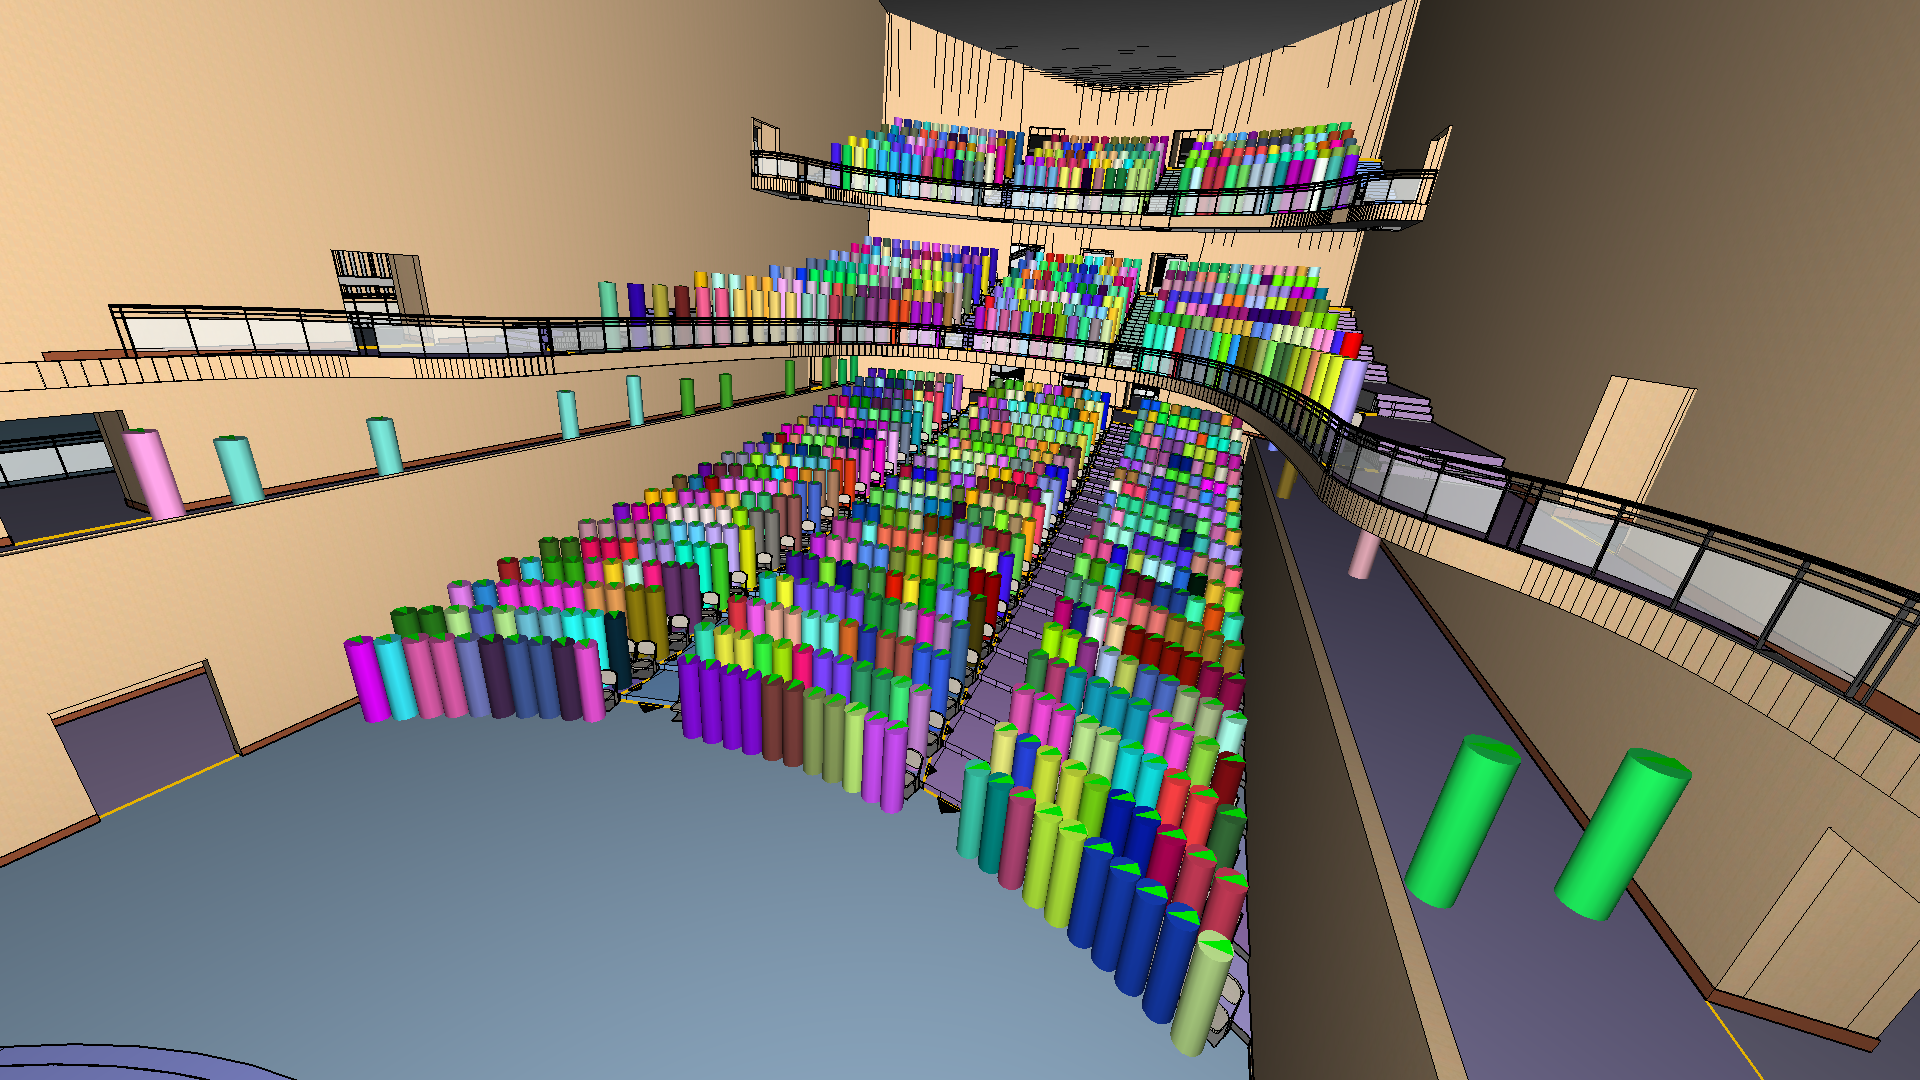
Figure 5 shows the auditorium and the audience consisting of children and adults. Three movement group templates are used, with group sizes of 1 (adult), 2 (adults), and 4 (two adults and two children). The colors in Figure 5 indicate the groups. The distribution has 29% of the people in a group of 1, 53% in a group of 2, and 18% in a group of 4. As noted, the distribution algorithm slightly favors smaller groups when filling small rooms (rows).
Three calculations were performed.
The base case did not include groups.
The second case included groups with a Maximum Distance of 1 m and Slowdown Time of 3 seconds.
This last case had tighter grouping with a Maximum Distance of 1 m and Slowdown Time of 3 seconds.
In all cases, the children’s speeds are uniformly distributed between 0.5 m/s to 1.0 m/s, and the adults from 0.7 m/s to 1.2 m/s.
A video showing part of the evacuation without groups and with groups with a Maximum Distance of 1 m is shown below. In general, there is slightly more congestion for the grouped case, so evacuation is slower.
Evacuation times show some dependence on grouping. The fastest evacuation was the case without groups, 533 seconds. Loosely connected groups with a Maximum Distance of 2 m showed essentially the same evacuation time, 538 seconds. And the tighter grouping with a Maximum Distance of 1 m showed a was slowest.
Summary
As expected, grouping leads to longer evacuation times. The first example, in which the groups assembled before exiting, essentially just adds to the initial response time of the occupants. In the second example, the grouping slows the evacuation of the auditorium since groups try to stay together and interfere with movement. Tighter groups showed slower evacuation times.
However, there is large uncertainty in the calculation of the effect of grouping on movement with insufficient experimental data to validate these calculations. At this time, grouping remains a tool to explore effects on evacuation. The results should not be viewed as validated.
To download the most recent version of Pathfinder, please visit the Pathfinder Support page and click the link for the current release. If you have any questions, please contact support@thunderheadeng.com
Related Tutorials
Video tutorial demonstrating the variables that may have an effect on evacuation time from aircraft cabins.
Video tutorial demonstrating the difference in evacuation times when occupant flow is properly balanced.
Video tutorial demonstrating how to effectively simulate evacuation of theaters and stadiums using Pathfinder.
Tutorial demonstrating the evacuation of a hospital
Update to a Pathfinder tutorial about simulating movement in a subway station, and uses triggers to simulate an emergency evacuation.
Tutorial demonstrating how to model passenger movement in a subway.
Video tutorial demonstarting how to assign exit goals to percentages of the occupant population.
This tutorial teaches the user how to create circulation movement using Queues.