To follow along with this post, download the file used here.
Introduction
In this post, we simulate evacuation of a center-platform station using Pathfinder and compare the results with NFPA 130 and SFPE calculations. The Standard for Fixed Guideway Transit and Passenger Rail Systems (NFPA 2020) covers life safety and fire protection requirements for passenger rail systems. NFPA 130 evacuation requirements are similar, but not identical, to those described in the SFPE Engineering Guide: Human Behavior in Fire (SFPE 2019) and the SFPE Handbook of Fire Protection Engineering, Chapters 56-63 (SFPE 2016). NFPA 130 is a standard that defines requirements, while SFPE is a handbook providing guidelines.
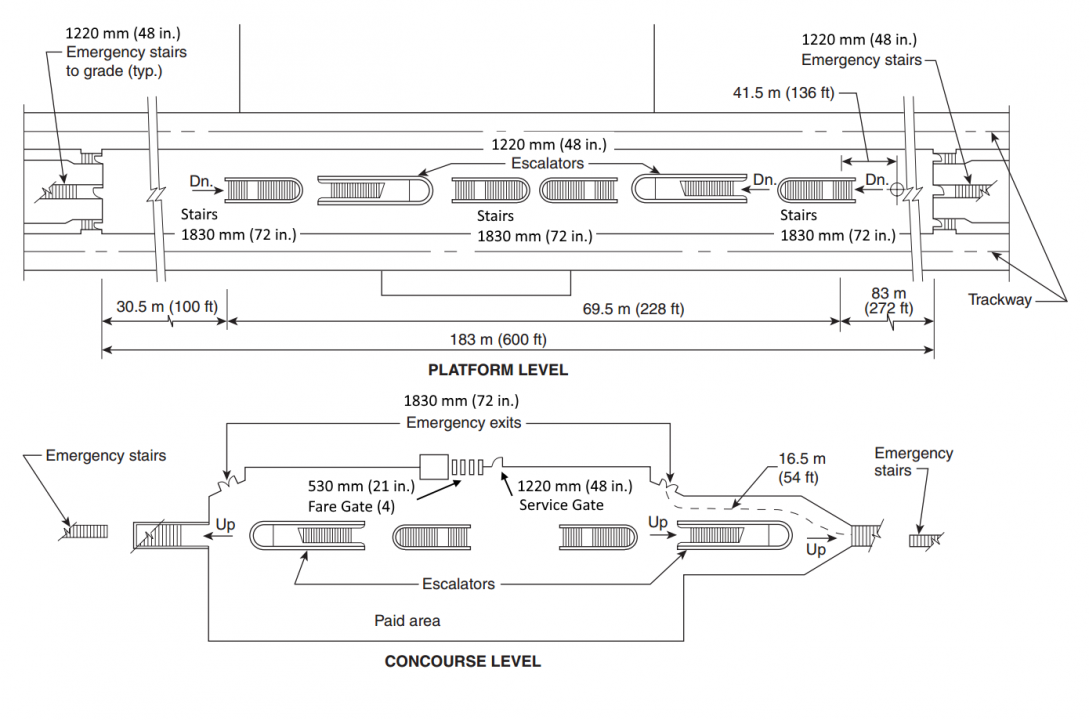
To compare evacuation results, we will use the center-platform station example described in NFPA 130 Annex C (NFPA 2020).
The center-platform station is an elevated station with the platform above the concourse.
The concourse is at grade.
The platform is 183 m (600 ft) long to accommodate the train length.
The platform is elevated 9.1 m (30 ft) above the concourse.
Six open wells communicate between the platform and the concourse.
Each well contains one stair or one escalator.
Details of the stairs and escalators are shown in Figure 1.
The station occupant load is 2314 persons.
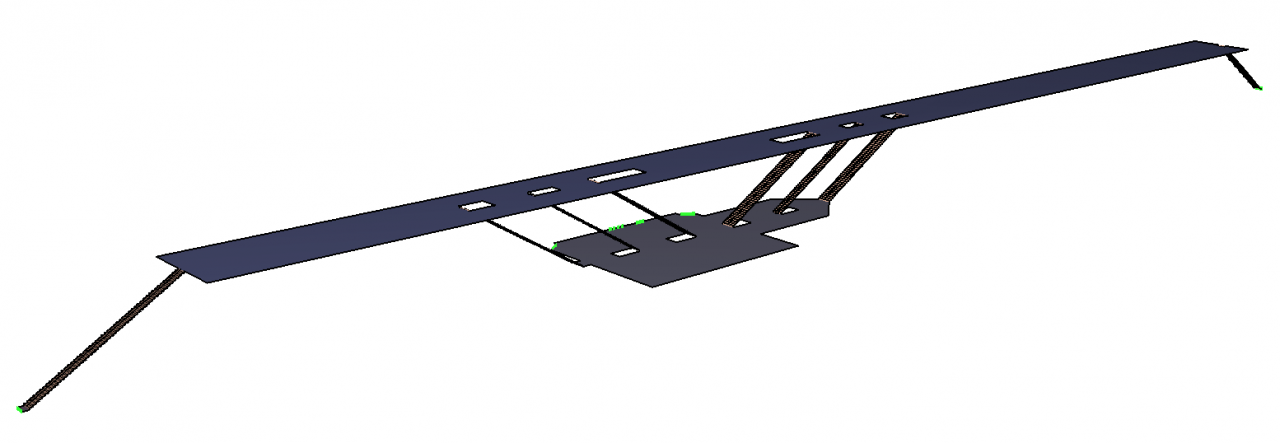
The corresponding Pathfinder model is shown in Figure 2.
The platform was assumed to be 9.75 m (32 ft) wide.
The stairs were assumed to have a rise and run of 178 x 280 mm (7 x 11 in.).
Fare gates have a minimum 457 mm (18 in.) width below 1000 mm (39.5 in.) and 530 mm (21 in.) width above.
The Pathfinder model assumed 530 mm (21 in.) fare gates for the egress calculation.
During evacuation, only one escalator is assumed to be available.
NFPA 130 and SFPE Calculation using Flow Rates
The flow rates for the evacuation components are shown below in Figure 3. For most of the components, the NFPA 130 flows are greater than the SFPE values, so we would expect NFPA 130 to predict a shorter evacuation time than SFPE.
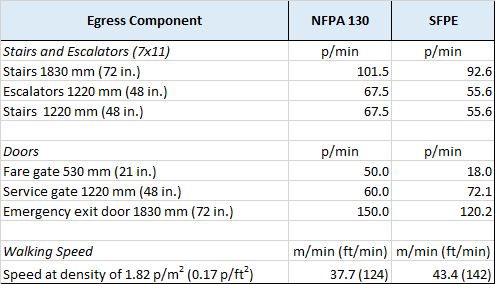
Assuming the 2314 occupants are distributed over a platform area 130.5 x 9.75 m (428 x 32 ft) the density is 1.82 p/m2 (0.17 p/ft2), the NFPA 130 walking speed is 37.7 m/min (124 ft/min) and the SFPE speed is 43.4 m/min (142 ft/min).
Now let us follow the highlights of the egress calculation.
Test No. 1: Evacuate platform occupant load in 4 minutes or less.
The total flow rates from the concourse are 609 p/min (NFPA 130) and 537 p/min (SFPE).
The corresponding times to clear the platform (platform occupant load/platform exit capacity) are \(F_{p}\) = 3.80 minutes (NFPA 130) and \(F_{p}\) = 4.31 minutes (SFPE).
The SFPE calculation would indicate the design does not meet specifications.
Test No. 2: Evacuate platform occupant load from most remote point on platform to a point of safety in 6 minutes or less.
On the platform the most remote location to the first stair is 41.5 m (136 ft). The time to walk this distance is \(T_{1}\) = 1.09 minutes (NFPA 130) and \(T_{1}\) = 0.96 minues (SFPE). The waiting times at the platform exits (\(W_{p} = F_{p} - T_{1}\)) are \(W_{p}\) = 2.71 minutes (NFPA 130) and \(W_{p}\) = 3.35 minutes (SFPE). The total walking times (T = platform + platform to concourse + concourse + grade to safe) are T = 2.23 for NFPA 130 and T = 1.95 SFPE.
Now we calculate the waiting times at the fare barrier. The platform took 3.80 minutes (NFPA 130) and 4.31 minutes (SFPE) to clear. During that time the number of occupants that exited the platform using the emergency stairs directly to grade (\(F_{p}\) * emergency stair capacity) are 513 (NFPA 130) and 479 (SFPE), leaving concourse occupant loads of 1801 (NFPA 130) and 1835 (SFPE). The fare barrier flow times for occupants to exit the concourse (concourse occupant load/concourse exit capacity) are \(F_{fb}\) = 3.22 minutes (NFPA 130) and \(F_{fb}\) = 4.77 minutes (SFPE). The time occupants must wait at the fare barrier (latexmath:[W_{fb} = F_{fb}-F_{p}) are zero for NFPA 130 and 0.46 minutes for SFPE.
Since the concourse exits are to grade, there is no waiting time at the concourse exits (\(W_{c} = 0\)).
The total exit time (\(Total time = T + W_{p} + W_{fb} + W_{c}\)) is then 4.94 minutes (296 seconds) for NFPA 130 and 5.76 minutes (346 seconds) for SFPE. Both calculations indicate the design passes Test 2.
Pathfinder Simulation Results
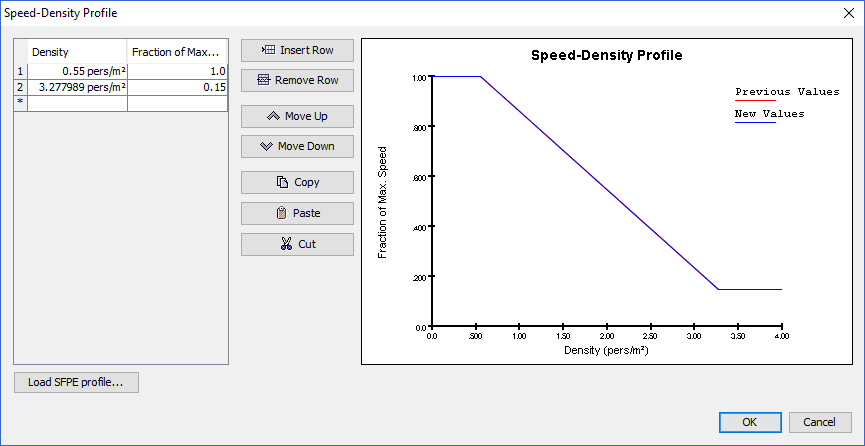
The Pathfinder simulation used the default occupant parameters. The default occupant walking speed is 1.19 m/s (3.9 ft/s) with a fundamental diagram that follows the SFPE speed-density curve as shown in Figure 4. These default occupant parameters have been calibrated to approximate the SFPE values for egress flow rates for doors, stairs, and corridors.
Each occupant acts as an independent agent. They choose an initial exit based on shortest estimated total exit times. However, they monitor the queues forming at the exits and will switch to a different exit if they perceive that to be advantageous (the preference is to remain in their current queue, see Pathfinder User Manual for details). In addition, each occupant avoids other occupants and barriers.
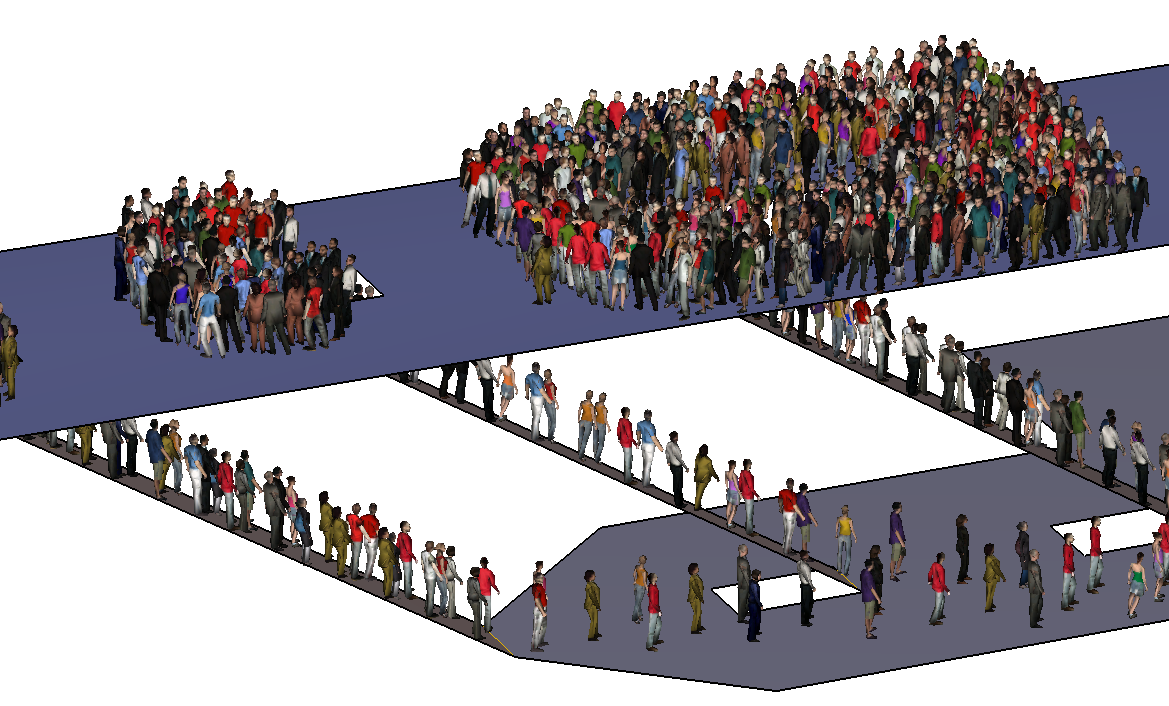
Figure 5 shows the queues that have formed at 60 seconds. The total Pathfinder exit time is 6.24 minutes vs. 4.94 minutes for NFPA 130 and 5.76 minutes for SFPE. The platform clears at 5.64 minutes vs. calculated 3.80 minutes (NFPA 130) and 4.31 minutes (SFPE). The concourse clears at 5.3 minutes. The concourse clears earlier than the platform because a queue forms at the furthest platform emergency exit and occupants remain committed to that exit rather than walk back to an open exit.
Summary
The comparison of evacuation times (4.94 minutes NFPA 130, 5.76 minutes SFPE, and 6.24 minutes Pathfinder) is consistent with expectations. The SFPE egress component flow rates are slower than NFPA 130, so the SFPE evacuation is longer. The main cause of the difference between Pathfinder and NFPA 130 and SFPE is that they assume full capacity use of all exits. When the preference to remain at the current exit and the penalty for walking distance were turned off, Pathfinder gave an exit time of 5.33 minutes.
The Pathfinder results represent what is intended to be a more realistic response during evacuation. In Pathfinder, not all exits are used to their full capacity throughout the evacuation. This is a first level of added realism.
Some other realistic Pathfinder features that were not used in this study include: initial delay times, distributions of walking speeds, occupants with impaired mobility, and fire fighter counterflow. Additional aspects that cannot be easily included in the current Pathfinder simulation include: grouping, fatigue, and impact of the fire (smoke, CO, temperature) on occupant movement. These are recognized as important and are discussed both in the SFPE Handbook and in a paper by Herbert T. Landow, Safe Egress for Deep Stations.
Using Pathfinder for evacuation simulation can add realism and be a check on other calculations you perform.
To download the most recent version of Pathfinder, please visit the Pathfinder Support page and click the link for the current release. If you have any questions, please contact support@thunderheadeng.com
Bibliography
NFPA. 2020. “NFPA 130 - Standard for Fixed Guidewat Transit and Passenger Rail Systems.” National Fire Protection Association.
SFPE. 2016. SFPE Handbook of Fire Protection Engineering. 5th ed. Springer-Verlag New York. https://www.springer.com/us/book/9781493925643.
———. 2019. SFPE Guide to Human Behavior in Fire. 2nd ed. Springer International Publishing. https://www.springer.com/gp/book/9783319946962.
Related Tutorials
Tutorial Comparing FDS results to fire spill-plume calculations in BRE Annex D.
Tutorial demonstrating how to model critical velocity in Pyrosim using the example of a tunnel fire.
Tutorial demonstrating how to model Smoke Visibility and Obscuration in Pyrosim.
Tutorial demonstrating how to model jet fans in Pyrosim.
Tutorial demonstrating how to create and FDS Velocity Patch in Pyrosim.
Tutorial demonstrating how to calculate complex stoichiometry in Pyrosim.
Tutorial demonstrating how to integrate Fractional Effective Doses with Evacuation Results.
Tutorial demonstrating how to verify HVAC Pressure Drop in Pyrosim.
