Overview
This tutorial is intended for event planners and other professionals interested in non-evacuation movement models in Pathfinder. It demonstrates how to create non-evacuation movement using the Queues feature introduced in Pathfinder 2021.2. Users will see examples of complex Queues, create complex circulation Behaviors, and couple Queues and Behaviors to create circulation movement in a model.
Before Starting
Before beginning this tutorial:
- Read the Simple Queues tutorial to learn the basics of Queues in Pathtfinder.
- Download the Cafeteria Model zip file to follow along.
- Read through the Queues section in the User Manual.
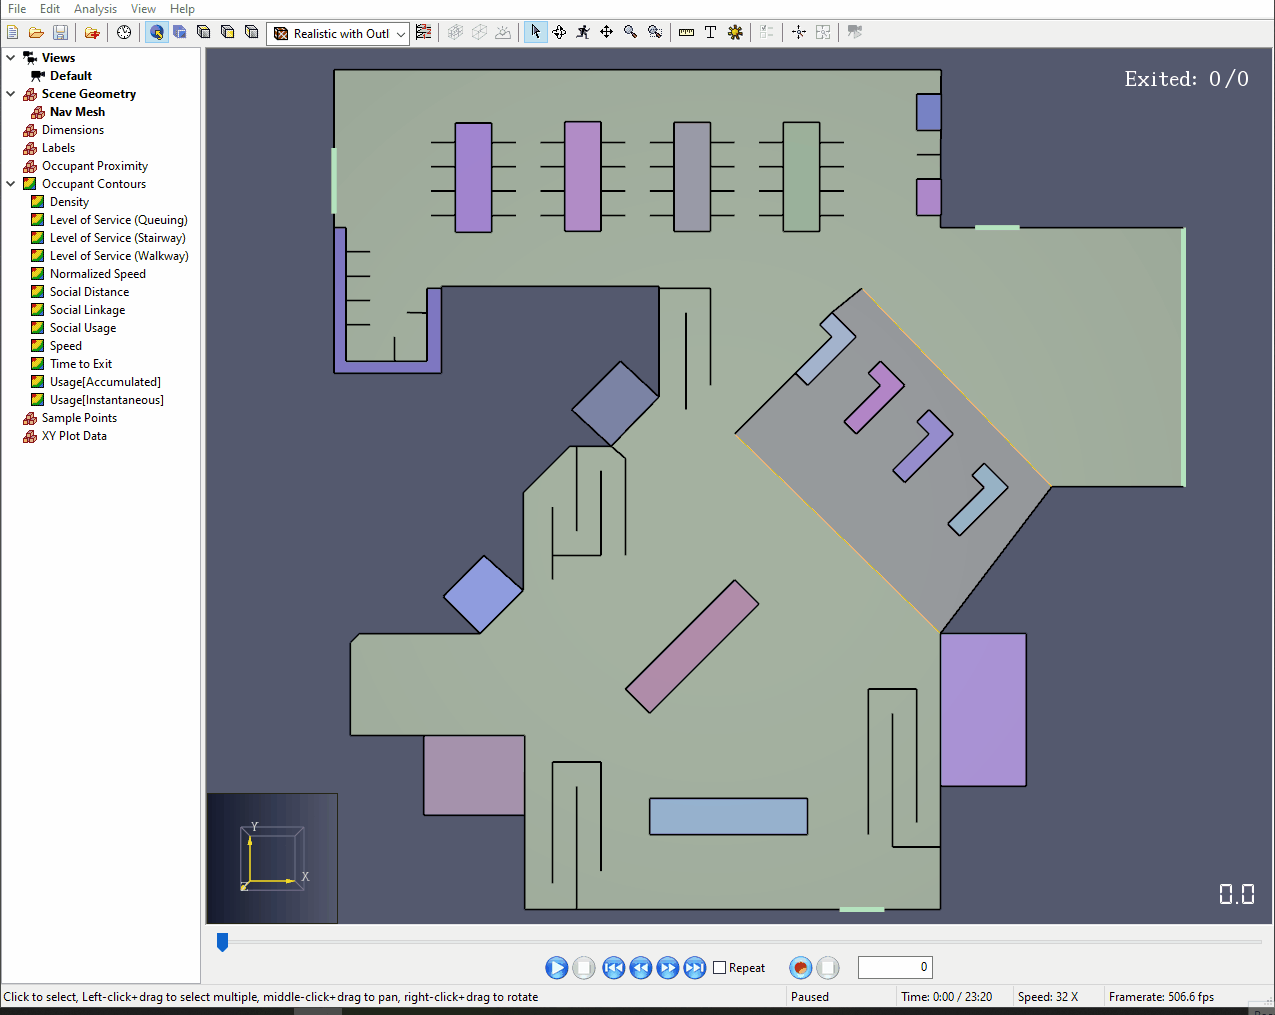
The Model
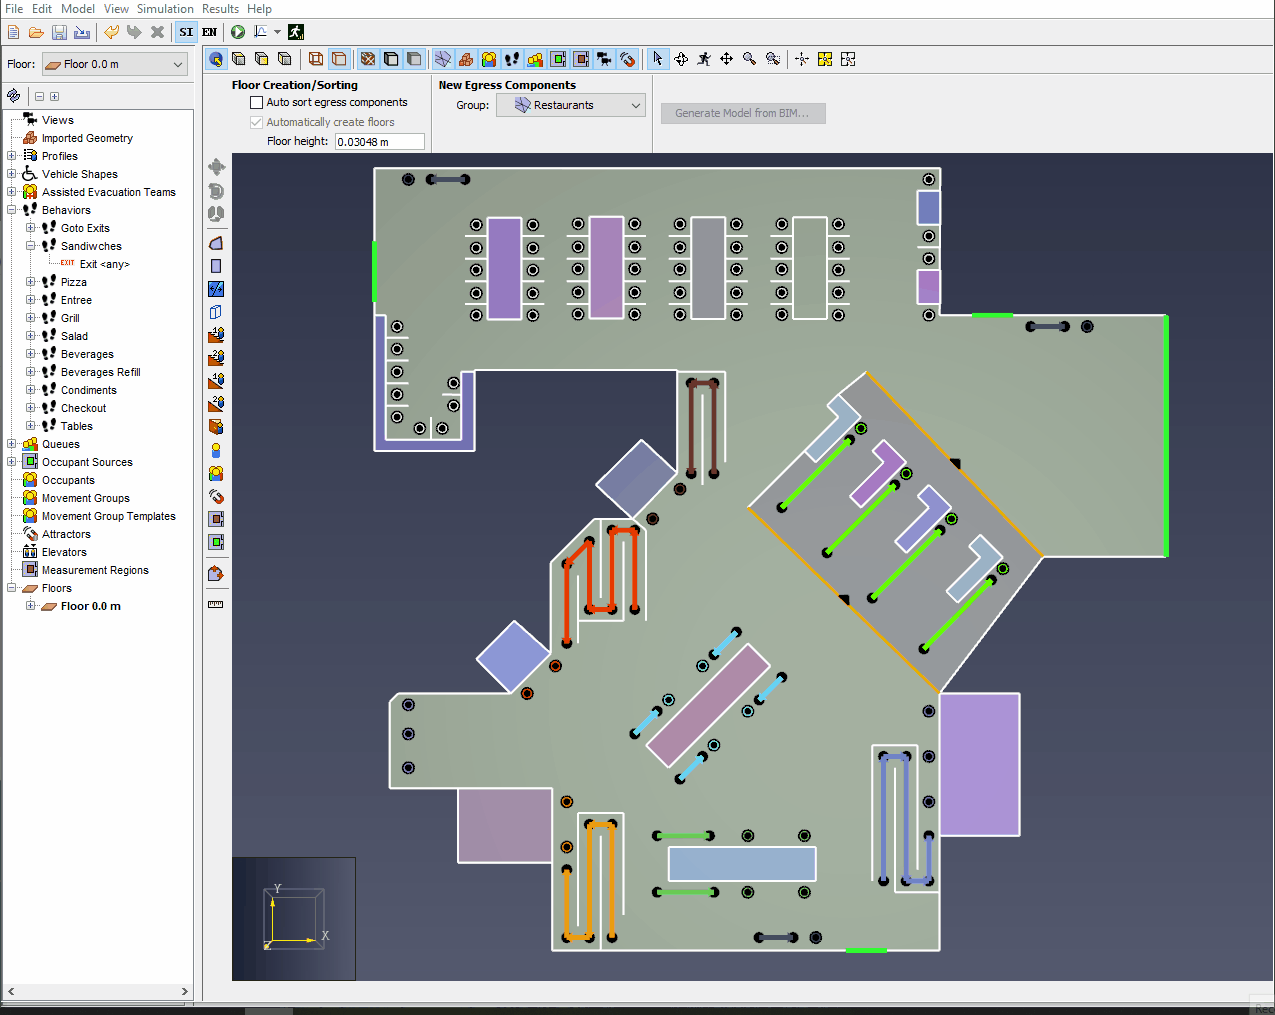
The model provided above is a cafeteria modeled in Pathfinder using Queues.
The pre-created Queues model several Queues that would be commonplace inside of a cafeteria, including food lines, beverage/condiment areas, and cafeteria table seating.
146 Occupants enter the model over 500s via an Occupant Source on the right-hand side of the model.
There are 4 potential exits, including the door through which the occupants enter.
By the end of this tutorial, Occupants will enter the model via the Occupant Source, circulate through the food serving area, checkout at the cashier, sit to eat their food, then leave the model through one of the exits.
Complex Queue Examples
This section will briefly cover some slightly more complex Queue examples than those covered in the Simple Queues tutorial. For simpler examples, check out that tutorial.
Tables
The Tables Queue is made up of a single Path with multiple Service Points. The Path is set up with the Force Follow Path and Visible parameters disabled. This hides the Path and allows Occupants to move just to the end of the Queue before moving to a Service Point. This allows for a more realistic movement where Occupants do not line up to get a seat. Instead, the Occupants appear to move directly to a Service Point and sit at a table.
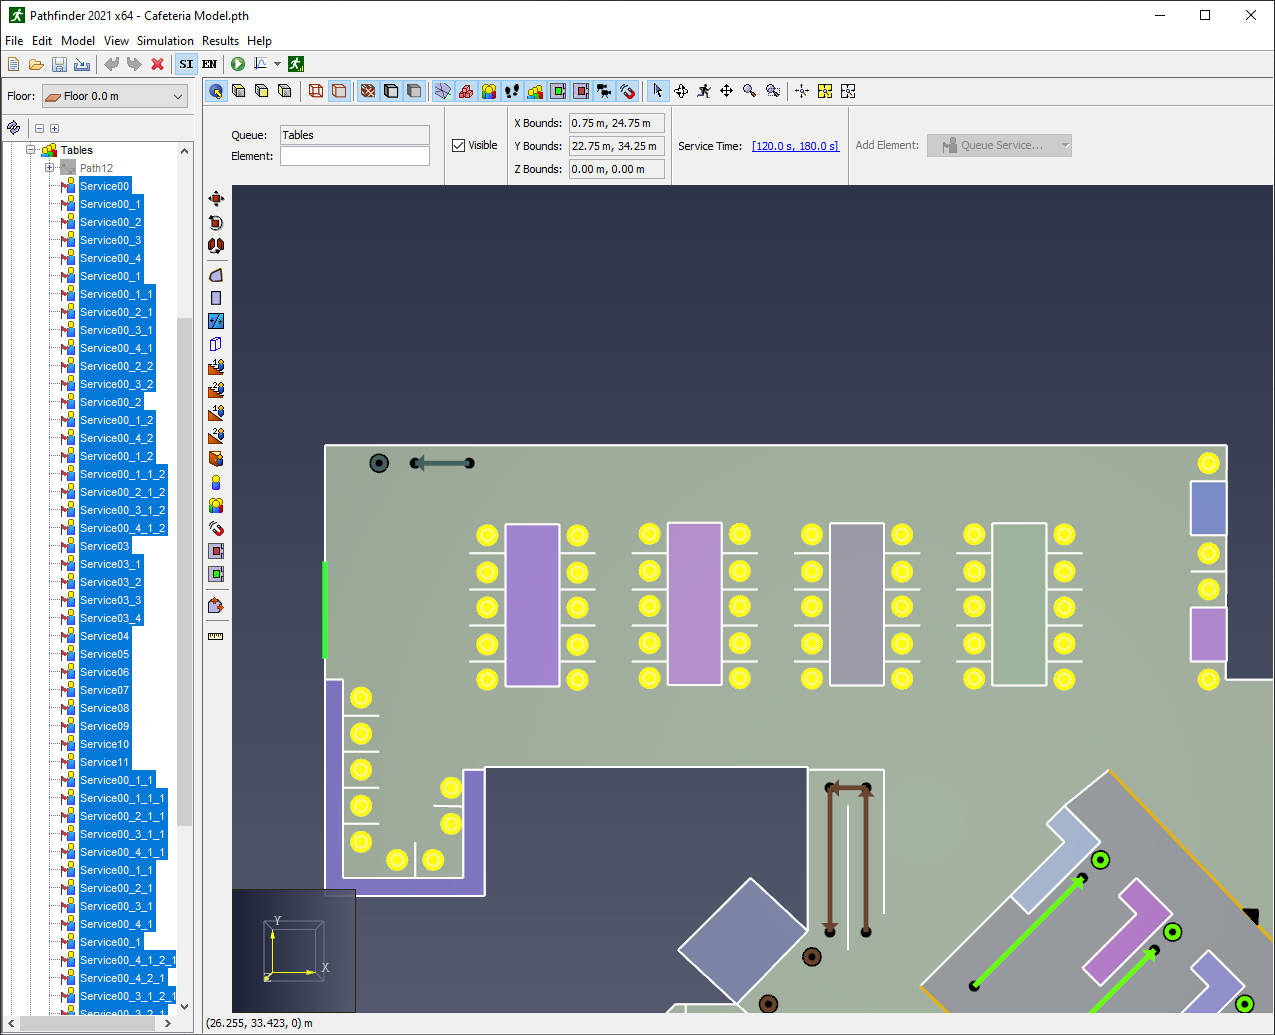
Tables Queue [highlighted] in the Cafeteria Model.Shown in Figure 1, there are Service Points representing seating at large cafeteria table, as well as some 2-person tables and cafe style wall seating.
Salads
The Salads Queue is a Queue Group made of 2 Queues, each with 1 Path and 2 Service Points. This Queue is similar to the Queue Group created in the Simple Queues tutorial, however this provides more Service Points for Occupant interaction to simulate Occupants serving themselves a salad at a salad bar.
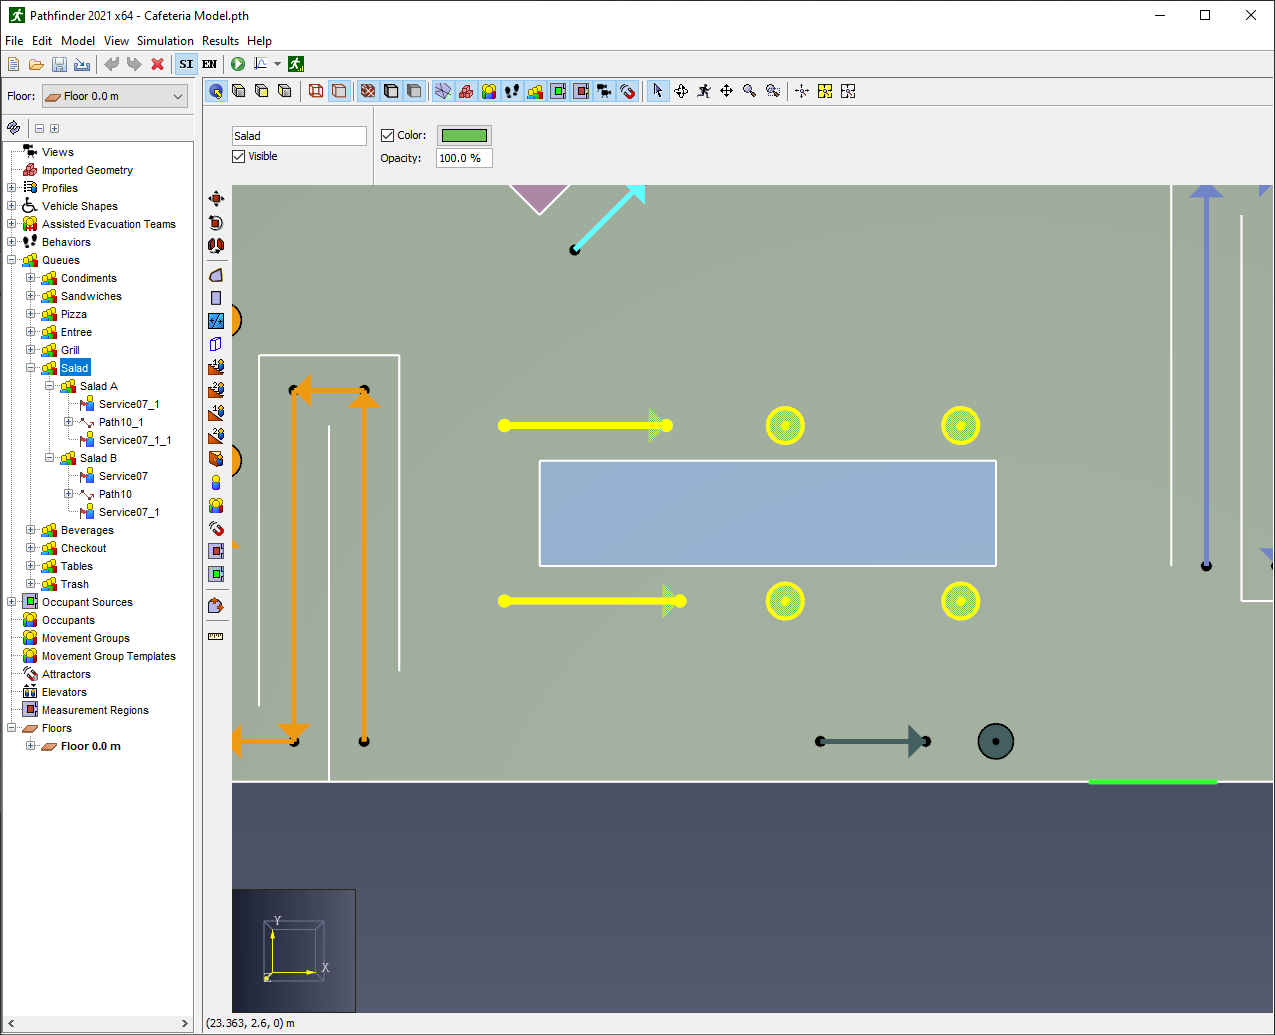
Salad Queue [highlighted] in the Cafeteria Model.Trash
The Trash Queue is a Queue Group made of 3 Queues, each with 1 Path and 1 Service Point. This Queue showcases that just because Queues are in the same Queue Group does not mean that they need to be close to each other geometrically. When Occupants are sent to the Trash Queue Group, they will move to one of the 3 Queues near exits to simulate Occupants throwing away their trash prior to leaving the cafeteria.
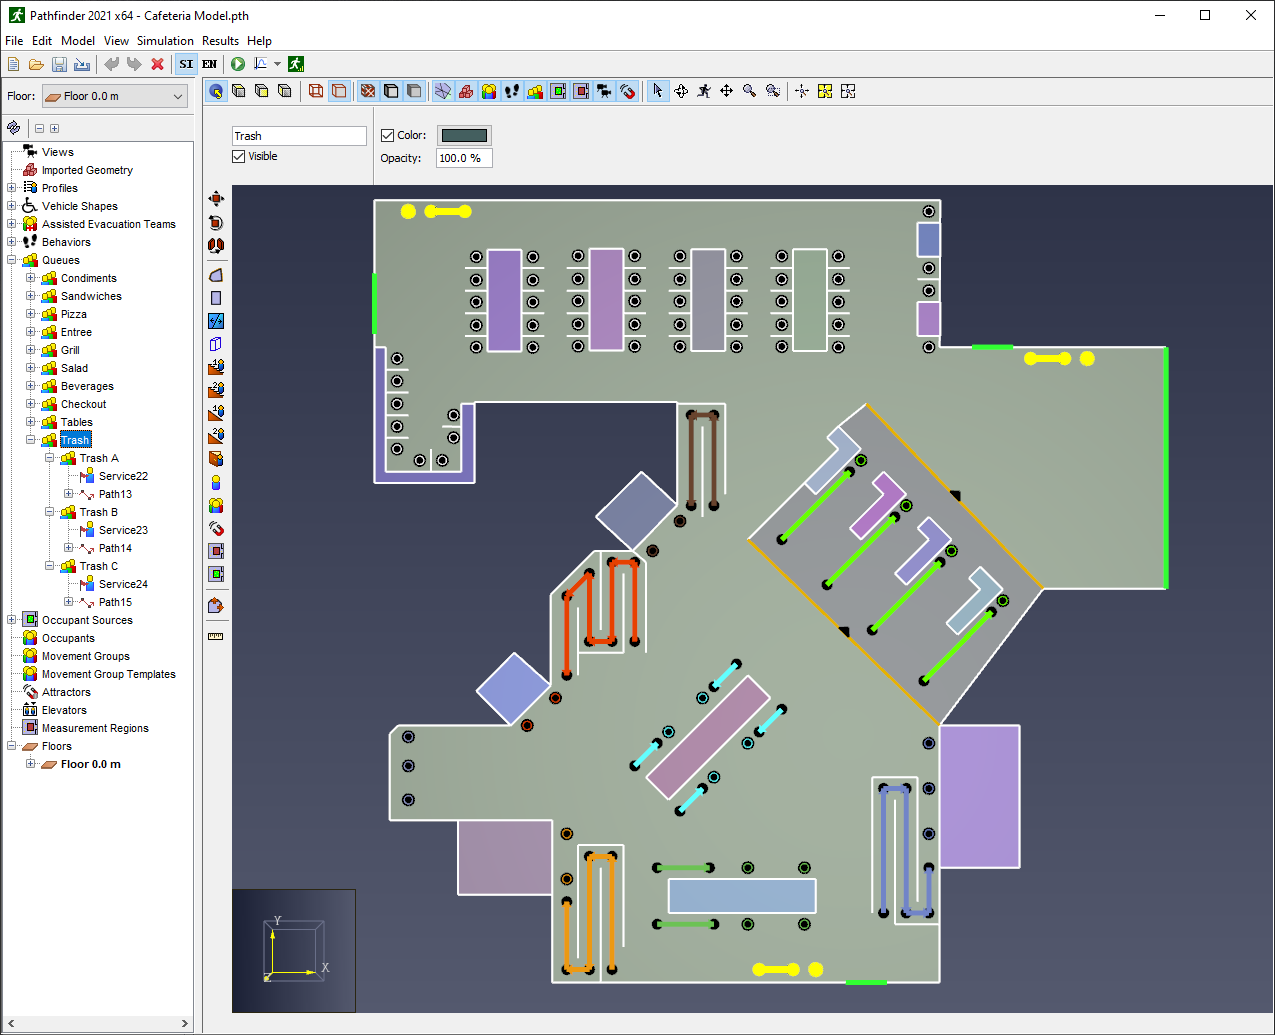
Trash Queue [highlighted] in the Cafeteria Model.Complex Circulation Behaviors
If the provided Cafeteria Model simulation is run as is, the Occupants will enter the model and then immediately exit through the nearest exit door.
This is because the Occupants only have the one GoTo Exits Behavior to follow.
They will need more Behaviors in order to simulate circulation movement.
This section will cover creation and implementation of Behaviors designed to create complex circulation movement in the provided model.
Restaurant Behaviors
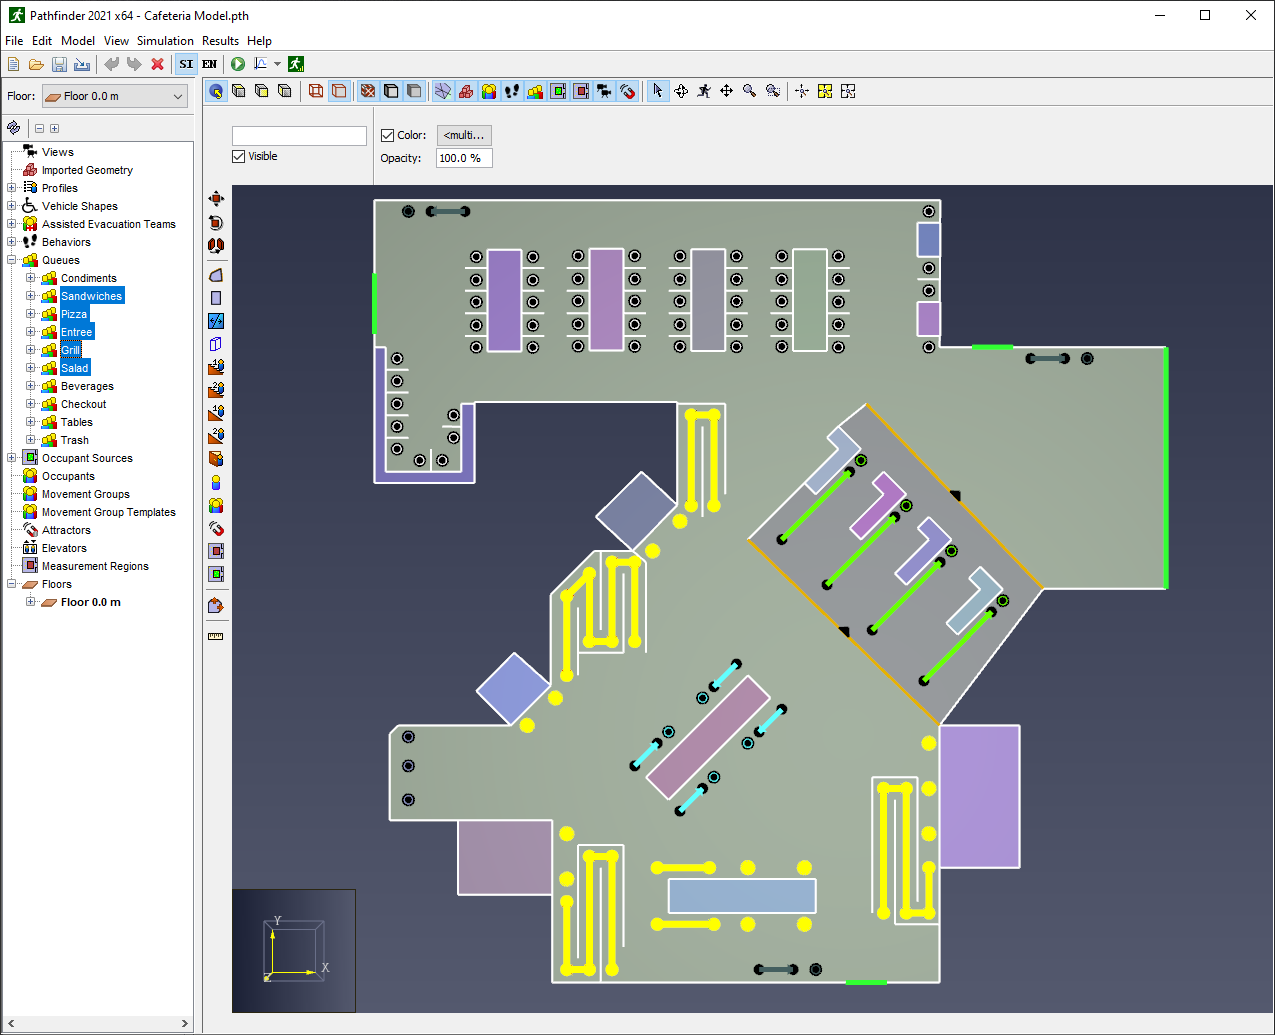
The main reason for Occupants entering this cafeteria would be to visit one of the 5 main restaurants present, highlighted in Figure 4.
To create Behaviors for each of the restaurants:
- Right-click the Behaviors root node in the Navigation View.
- Click Add a Behavior.
- Name the new Behavior
Sandwiches, then click Ok. - Repeats steps 1-3 to create 9 more Behaviors with the names
Pizza,Entree,Grill,Salad,Beverages,Beverages Refill,Condiments,Checkout, andTables.
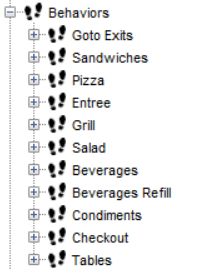
The model should now have all the behaviors shown in Figure 5.
Many of these Behaviors will be set up in later sections.
This section will focus on the 5 main "restaurant" Behaviors - Sandwiches, Pizza, Entree, Grill, and Salad.
For each of the 5 "restaurant" Behaviors:
- Select the Behavior in the Navigation View.
- Click the arrow in the dropdown next to Add Action.
- Select the GoTo Queues Action.
- Click the hyperlink next to Queue.
- In the searchbar, search for the Queue Group with the same name as the Behavior.
- Select the Queue Group from the list, then click Create.
- Delete the GoTo Exits Action from the Behavior.
- Select the Behavior in the Navigation View.
- Click the arrow in the dropdown next to Add Action.
- Select the Change Behavior Action.
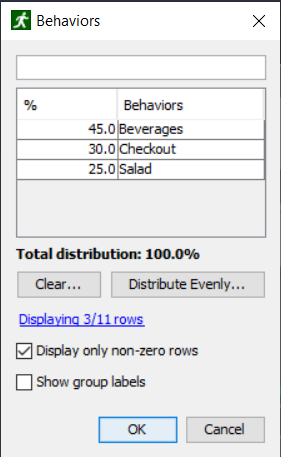
- In the Target Behaviors dialog, click Clear, then Clear all rows.
- Deselect Display only non-zero rows.
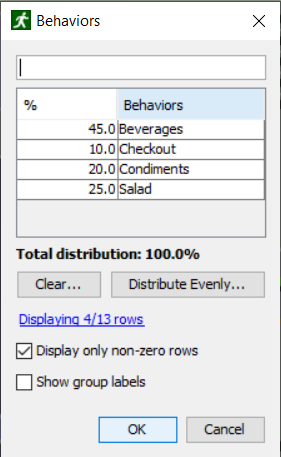
- Enter the Distribution shown in Figure 7, then click Create.
Note that this distribution should not be applied to the
SaladBehavior. That Behavior should have a 60% Beverages, 40% Checkout distribution to avoid a circularSaladBehavior loop. - If needed, re-order the Actions in the Behavior so that the GoTo Queues Action is the top Action.
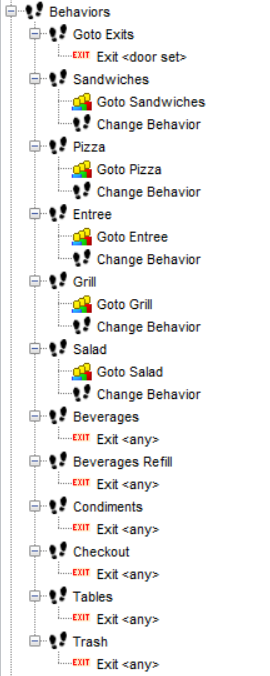
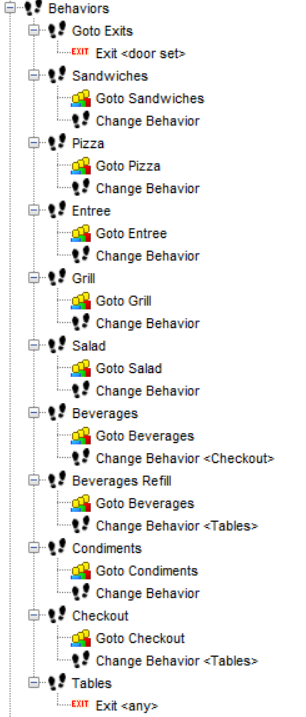
After doing this to all 5 "restaurant" Behaviors, the model should have the following Behaviors:
Secondary Item Behaviors
After Occupants have gone through a Queue and received their meal, they should proceed to a number of secondary Behaviors.
These secondary Behaviors are represented by the Beverages, Beverages Refill, Condiments, and Checkout Behaviors.
These Behaviors are created similarly to the "restaurant" Behaviors, however their distributions are different.
To create these Behaviors:
- Like in Steps 5-10 of Restaurant Behaviors, add a GoTo Queue Action for the appropriate Queue Group for each Behavior.
- Delete the Exit Action from each Behavior.
- Add a Change Behavior Action to the Behavior based on the following distributions:
- The
BeveragesBehavior should change Behavior 100% toCheckout. - The
Beverages RefillandCheckoutBehaviors should change 100% toTables. - The
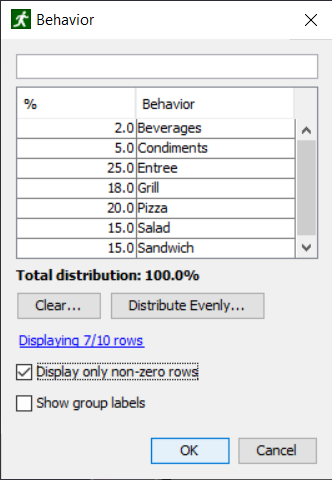
CondimentsBehavior should change to the distribution shown in Figure 9.
- The
After creating the secondary item Behaviors, the model should have the following Behaviors:
Terminal Behavior
The last Behavior to create is, of course, the Terminal Behavior. This is the Behavior that all Occupants will encounter that will eventually trigger their terminal Action in the model which, in most cases including this one, will be an Exit Action.
The Terminal Behavior in this model will be the Tables Behavior.
After getting and paying for their food, Occupants should proceed to a seat at a table to eat, optionally get a refill of their beverage, then throw away their trash and leave the model.
To create this Behavior:
- Select the
TablesBehavior. - Like in Steps 5-10 of Restaurant Behaviors, add a GoTo Queue Action for the
TablesQueue Group. - Delete the Exit Action from each Behavior.
- Add a Change Behavior Action with a 15% change to the
Beverages RefillBehavior and 85% toNo Change. - Add another GoTo Queue Action for the
TrashQueue Group. - Add a final Exit Action targeting all exits.
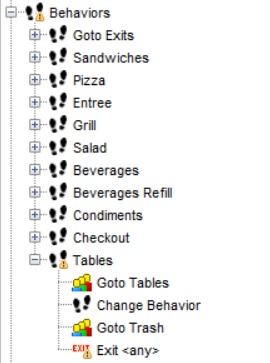
After this, the Behavior should look like Figure 11.
With this Behavior created, all Behaviors are now configured and ready for use.
Complex Circulation Movement
With all Behaviors created, the only thing left to do is to assign Occupants an initial Behavior and allow them to naturally move through the model.
Initial Distribution
To set the initial Behavior distribution:
- Select the
Entry SourceOccupant Source in the Navigation View. - Click the hyperlink next to Behavior in the Properties Panel.
- Enter the distribution shown in Figure 12.
This distribution simulates that most Occupants entering the model will head to one of the 5 "restaurants", but a few of them may enter solely to grab a beverage or something from the condiments counter. These Behaviors will be applied as soon as Occupants enter the model.
Results
The cafeteria model is now configured.
Click the ![]() Run Simulation icon to run the simulation.
In the Results window, click the play button to view how Occupants move through the model.
Run Simulation icon to run the simulation.
In the Results window, click the play button to view how Occupants move through the model.
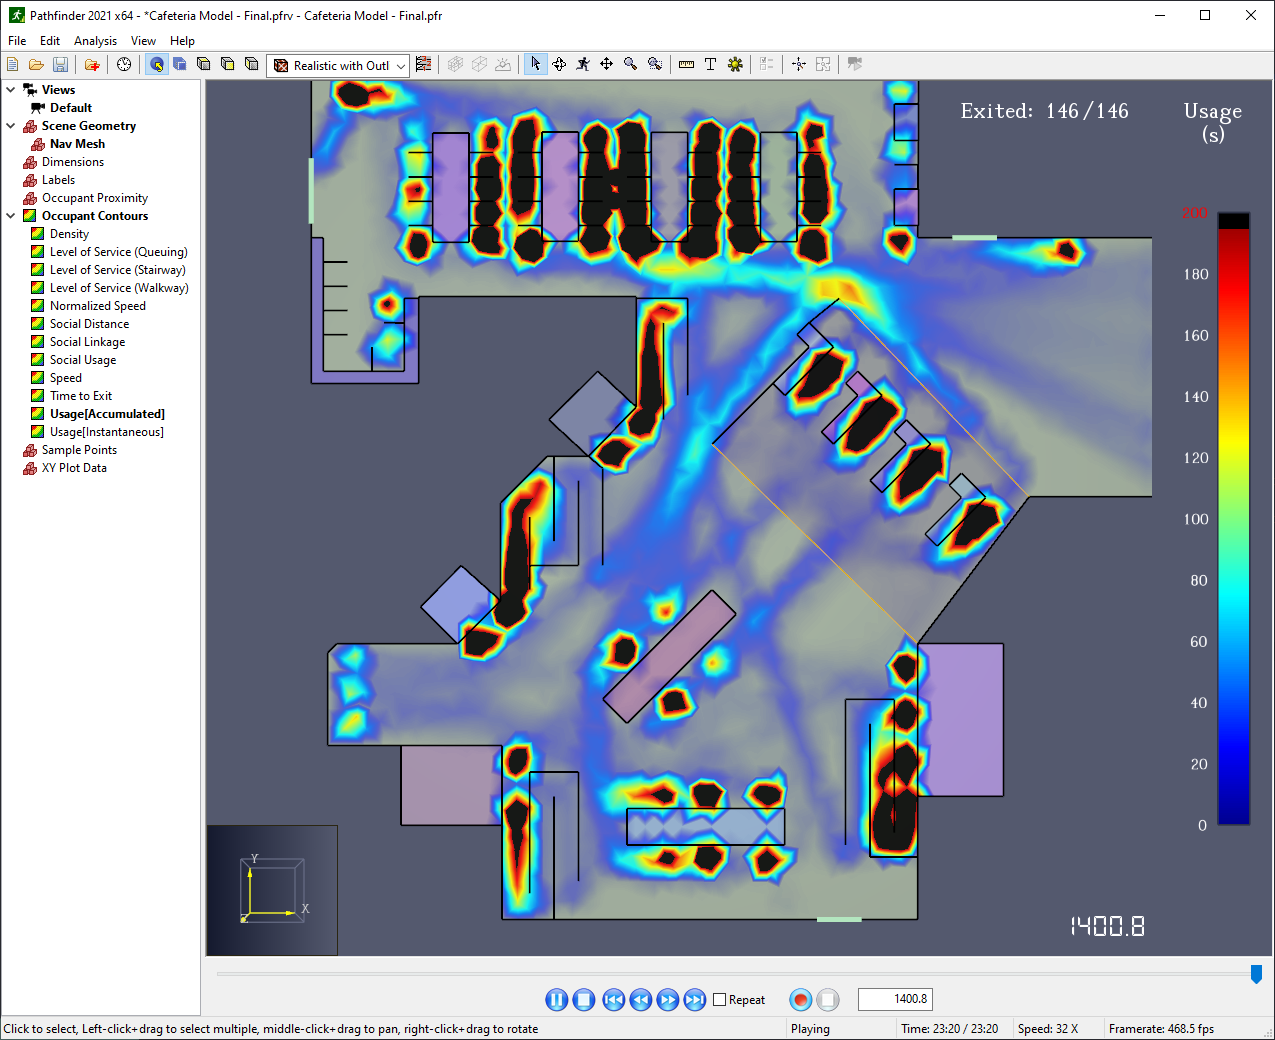
As can be seen in Figure 13, Occupants enter the model, collect their food, beverages, and condiments, move through the checkout Queue, sit down to eat, then throw away their trash and leave the model. The specific percentage of Occupants moving through each Queue can be controlled by altering the distributions that feed the Queue.
The Accumulated Usage contour is currently the best way to visualize which Queues Occupants use the most. Figure 14 shows the Accumulated Usage contour for this model. It shows that the Condiments Queue is the most lightly used Queue while the 2 central tables in the Tables Queue are the most heavily used. It also shows that while the tables are heavily used, the bar style seating in the corner of the model are rarely used by Occupants.
As always, these results are only as good as the engineering assumptions put in to the simulation set-up. Circulation models have a lot of variables associated with them, each of which compounds error. In this tutorial, the primary variables introduced that affect circulation movement are the percentage distributions in the Change Behavior Actions and the wait times at Queue Service Points. Changes to these variables will have the largest effects on movement through Queues in the model. Keep this in mind for future models using this method.
Conclusion
Users should now have an understanding of how to create Circulation Movement models in Pathfinder using the new Queues feature. Users should also be more familiar with some more complex configurations of Queues and with the more complex interactions of Behaviors possible with Pathfinder.
To download the most recent version of Pathfinder, please visit the Pathfinder support page and click the link for the current release. Please contact support@thunderheadeng.com with any questions or feedback regarding our products or documentation.
Related Tutorials
Tutorial demonstrating how to create circulation movement in a model.
Update to a Pathfinder tutorial about simulating movement in a subway station, and uses triggers to simulate an emergency evacuation.
Tutorial demonstrating how to model passenger movement in a subway.
Video tutorial demonstrating the difference in evacuation times when occupant flow is properly balanced.
Video tutorial demonstrating how to effectively simulate evacuation of theaters and stadiums using Pathfinder.
This tutorial teaches the user how to create Triggers in Pathfinder models.
Tutorial demonstrating how to model occupants that respond to Triggers to shop.
Tutorial demonstrating how to model occupants that respond to Triggers to evacuate.